Native Hawaiian vs Lithuanian Unemployment Among Ages 65 to 74 years

COMPARE

Native Hawaiian
Race
Ancestry
AfghanAfricanAlaska NativeAlaskan AthabascanAlbanianAleutAlsatianAmericanApacheArabArapahoArgentineanArmenianAssyrian/Chaldean/SyriacAustralianAustrianBahamianBangladeshiBarbadianBasqueBelgianBelizeanBermudanBhutaneseBlackfeetBolivianBrazilianBritishBritish West IndianBulgarianBurmeseCajunCambodianCanadianCape VerdeanCarpatho RusynCelticCentral AmericanCentral American IndianCherokeeCheyenneChickasawChileanChineseChippewaChoctawColombianColvilleComancheCosta RicanCreeCreekCroatianCrowCubanCypriotCzechCzechoslovakianDanishDelawareDominicanDutchDutch West IndianEastern EuropeanEcuadorianEgyptianEnglishEstonianEthiopianEuropeanFijianFilipinoFinnishFrenchFrench American IndianFrench CanadianGermanGerman RussianGhanaianGreekGuamanian/ChamorroGuatemalanGuyaneseHaitianHmongHonduranHopiHoumaHungarianIcelanderIndian (Asian)IndonesianInupiatIranianIraqiIrishIroquoisIsraeliItalianJamaicanJapaneseJordanianKenyanKiowaKoreanLaotianLatvianLebaneseLiberianLumbeeLuxembourgerMacedonianMalaysianMalteseMarshalleseMenomineeMexicanMexican American IndianMongolianMoroccanNative HawaiianNavajoNepaleseNew ZealanderNicaraguanNigerianNorthern EuropeanNorwegianOkinawanOsageOttawaPaiutePakistaniPalestinianPanamanianParaguayanPennsylvania GermanPeruvianPimaPolishPortuguesePotawatomiPuebloPuerto RicanPuget Sound SalishRomanianRussianSalvadoranSamoanScandinavianScotch-IrishScottishSeminoleSenegaleseSerbianShoshoneSierra LeoneanSiouxSlavicSlovakSloveneSomaliSouth AfricanSouth AmericanSouth American IndianSoviet UnionSpaniardSpanishSpanish AmericanSpanish American IndianSri LankanSubsaharan AfricanSudaneseSwedishSwissSyrianTaiwaneseThaiTlingit-HaidaTohono O'OdhamTonganTrinidadian and TobagonianTsimshianTurkishU.S. Virgin IslanderUgandanUkrainianUruguayanUteVenezuelanVietnameseWelshWest IndianYakamaYaquiYugoslavianYumanYup'ikZimbabwean
Immigration
NonimmigrantsImmigrantsAfghanistanAfricaAlbaniaArgentinaArmeniaAsiaAustraliaAustriaBahamasBangladeshBarbadosBelarusBelgiumBelizeBoliviaBosnia and HerzegovinaBrazilBulgariaBurma/MyanmarCabo VerdeCambodiaCameroonCanadaCaribbeanCentral AmericaChileChinaColombiaCongoCosta RicaCroatiaCubaCzechoslovakiaDenmarkDominicaDominican RepublicEastern AfricaEastern AsiaEastern EuropeEcuadorEgyptEl SalvadorEnglandEritreaEthiopiaEuropeFijiFranceGermanyGhanaGreeceGrenadaGuatemalaGuyanaHaitiHondurasHong KongHungaryIndiaIndonesiaIranIraqIrelandIsraelItalyJamaicaJapanJordanKazakhstanKenyaKoreaKuwaitLaosLatin AmericaLatviaLebanonLiberiaLithuaniaMalaysiaMexicoMicronesiaMiddle AfricaMoldovaMoroccoNepalNetherlandsNicaraguaNigeriaNorth AmericaNorth MacedoniaNorthern AfricaNorthern EuropeNorwayOceaniaPakistanPanamaPeruPhilippinesPolandPortugalRomaniaRussiaSaudi ArabiaScotlandSenegalSerbiaSierra LeoneSingaporeSomaliaSouth AfricaSouth AmericaSouth Central AsiaSouth Eastern AsiaSouthern EuropeSpainSri LankaSt. Vincent and the GrenadinesSudanSwedenSwitzerlandSyriaTaiwanThailandTrinidad and TobagoTurkeyUgandaUkraineUruguayUzbekistanVenezuelaVietnamWest IndiesWestern AfricaWestern AsiaWestern EuropeYemenZaireZimbabweAzores
Lithuanian
Race
Ancestry
AfghanAfricanAlaska NativeAlaskan AthabascanAlbanianAleutAlsatianAmericanApacheArabArapahoArgentineanArmenianAssyrian/Chaldean/SyriacAustralianAustrianBahamianBangladeshiBarbadianBasqueBelgianBelizeanBermudanBhutaneseBlackfeetBolivianBrazilianBritishBritish West IndianBulgarianBurmeseCajunCambodianCanadianCape VerdeanCarpatho RusynCelticCentral AmericanCentral American IndianCherokeeCheyenneChickasawChileanChineseChippewaChoctawColombianColvilleComancheCosta RicanCreeCreekCroatianCrowCubanCypriotCzechCzechoslovakianDanishDelawareDominicanDutchDutch West IndianEastern EuropeanEcuadorianEgyptianEnglishEstonianEthiopianEuropeanFijianFilipinoFinnishFrenchFrench American IndianFrench CanadianGermanGerman RussianGhanaianGreekGuamanian/ChamorroGuatemalanGuyaneseHaitianHmongHonduranHopiHoumaHungarianIcelanderIndian (Asian)IndonesianInupiatIranianIraqiIrishIroquoisIsraeliItalianJamaicanJapaneseJordanianKenyanKiowaKoreanLaotianLatvianLebaneseLiberianLithuanianLumbeeLuxembourgerMacedonianMalaysianMalteseMarshalleseMenomineeMexicanMexican American IndianMongolianMoroccanNavajoNepaleseNew ZealanderNicaraguanNigerianNorthern EuropeanNorwegianOkinawanOsageOttawaPaiutePakistaniPalestinianPanamanianParaguayanPennsylvania GermanPeruvianPimaPolishPortuguesePotawatomiPuebloPuerto RicanPuget Sound SalishRomanianRussianSalvadoranSamoanScandinavianScotch-IrishScottishSeminoleSenegaleseSerbianShoshoneSierra LeoneanSiouxSlavicSlovakSloveneSomaliSouth AfricanSouth AmericanSouth American IndianSoviet UnionSpaniardSpanishSpanish AmericanSpanish American IndianSri LankanSubsaharan AfricanSudaneseSwedishSwissSyrianTaiwaneseThaiTlingit-HaidaTohono O'OdhamTonganTrinidadian and TobagonianTsimshianTurkishU.S. Virgin IslanderUgandanUkrainianUruguayanUteVenezuelanVietnameseWelshWest IndianYakamaYaquiYugoslavianYumanYup'ikZimbabwean
Immigration
NonimmigrantsImmigrantsAfghanistanAfricaAlbaniaArgentinaArmeniaAsiaAustraliaAustriaBahamasBangladeshBarbadosBelarusBelgiumBelizeBoliviaBosnia and HerzegovinaBrazilBulgariaBurma/MyanmarCabo VerdeCambodiaCameroonCanadaCaribbeanCentral AmericaChileChinaColombiaCongoCosta RicaCroatiaCubaCzechoslovakiaDenmarkDominicaDominican RepublicEastern AfricaEastern AsiaEastern EuropeEcuadorEgyptEl SalvadorEnglandEritreaEthiopiaEuropeFijiFranceGermanyGhanaGreeceGrenadaGuatemalaGuyanaHaitiHondurasHong KongHungaryIndiaIndonesiaIranIraqIrelandIsraelItalyJamaicaJapanJordanKazakhstanKenyaKoreaKuwaitLaosLatin AmericaLatviaLebanonLiberiaLithuaniaMalaysiaMexicoMicronesiaMiddle AfricaMoldovaMoroccoNepalNetherlandsNicaraguaNigeriaNorth AmericaNorth MacedoniaNorthern AfricaNorthern EuropeNorwayOceaniaPakistanPanamaPeruPhilippinesPolandPortugalRomaniaRussiaSaudi ArabiaScotlandSenegalSerbiaSierra LeoneSingaporeSomaliaSouth AfricaSouth AmericaSouth Central AsiaSouth Eastern AsiaSouthern EuropeSpainSri LankaSt. Vincent and the GrenadinesSudanSwedenSwitzerlandSyriaTaiwanThailandTrinidad and TobagoTurkeyUgandaUkraineUruguayUzbekistanVenezuelaVietnamWest IndiesWestern AfricaWestern AsiaWestern EuropeYemenZaireZimbabweAzores
Unemployment Among Ages 65 to 74 years
Income
Poverty
Unemployment
Labor Participation
Family Structure
Vehicle Availability
Education Level
Disability

Unemployment Among Ages 65 to 74 years Comparison

Native Hawaiians

Lithuanians

Tragic
Fair
5.6%
UNEMPLOYMENT AMONG AGES 65 TO 74 YEARS
0.4/ 100
METRIC RATING
256th/ 347
METRIC RANK
5.4%
UNEMPLOYMENT AMONG AGES 65 TO 74 YEARS
32.4/ 100
METRIC RATING
186th/ 347
METRIC RANK

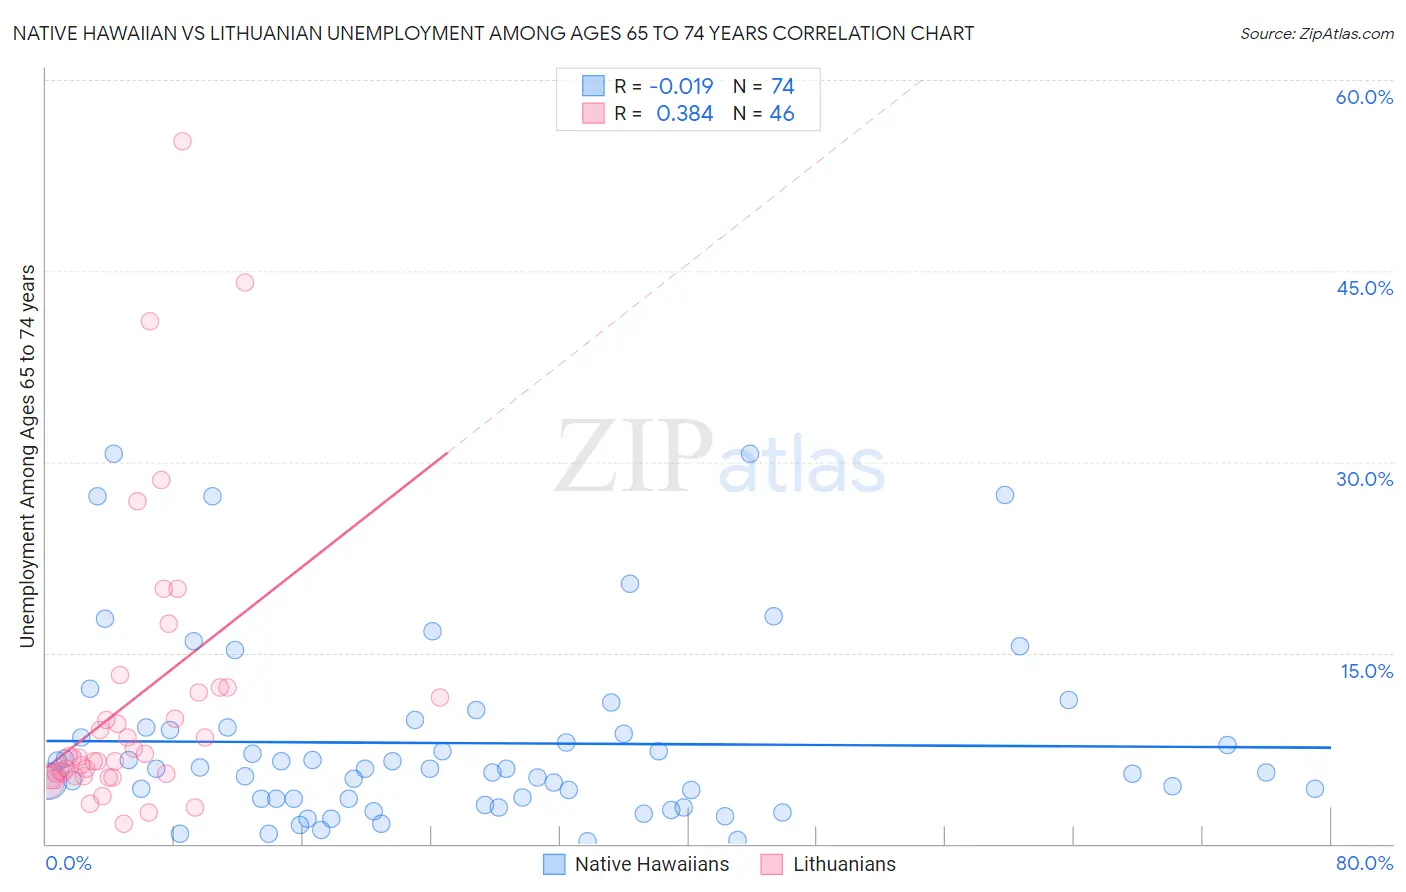
Native Hawaiian vs Lithuanian Unemployment Among Ages 65 to 74 years Correlation Chart

The statistical analysis conducted on geographies consisting of 294,979,379 people shows no correlation between the proportion of Native Hawaiians and unemployment rate among population between the ages 65 and 74 in the United States with a correlation coefficient (R) of -0.019 and weighted average of 5.6%. Similarly, the statistical analysis conducted on geographies consisting of 364,262,571 people shows a mild positive correlation between the proportion of Lithuanians and unemployment rate among population between the ages 65 and 74 in the United States with a correlation coefficient (R) of 0.384 and weighted average of 5.4%, a difference of 4.1%.
Native Hawaiian vs Lithuanian Unemployment Among Ages 65 to 74 years

Unemployment Among Ages 65 to 74 years Correlation Summary

MeasurementNative HawaiianLithuanian
Minimum0.20%1.6%
Maximum30.7%55.2%
Range30.5%53.6%
Mean7.9%11.2%
Median5.9%6.8%
Interquartile 25% (IQ1)3.5%5.3%
Interquartile 75% (IQ3)9.1%11.9%
Interquartile Range (IQR)5.6%6.6%
Standard Deviation (Sample)7.1%11.2%
Standard Deviation (Population)7.1%11.1%

Similar Demographics by Unemployment Among Ages 65 to 74 years

Demographics Similar to Native Hawaiians by Unemployment Among Ages 65 to 74 years

In terms of unemployment among ages 65 to 74 years, the demographic groups most similar to Native Hawaiians are Immigrants from Haiti (5.6%, a difference of 0.10%), Immigrants from Southern Europe (5.6%, a difference of 0.12%), Immigrants from Costa Rica (5.6%, a difference of 0.19%), Immigrants from Brazil (5.6%, a difference of 0.21%), and Colombian (5.6%, a difference of 0.27%).
DemographicsRating | RankUnemployment Among Ages 65 to 74 years
Trinidadians and Tobagonians
0.8
/100
|
#249
Tragic
5.6%
Cape Verdeans
0.7
/100
|
#250
Tragic
5.6%
Brazilians
0.5
/100
|
#251
Tragic
5.6%
Colombians
0.5
/100
|
#252
Tragic
5.6%
Immigrants | Brazil
0.5
/100
|
#253
Tragic
5.6%
Immigrants | Costa Rica
0.5
/100
|
#254
Tragic
5.6%
Immigrants | Haiti
0.4
/100
|
#255
Tragic
5.6%
Native Hawaiians
0.4
/100
|
#256
Tragic
5.6%
Immigrants | Southern Europe
0.3
/100
|
#257
Tragic
5.6%
Immigrants | Western Africa
0.3
/100
|
#258
Tragic
5.6%
Sierra Leoneans
0.2
/100
|
#259
Tragic
5.6%
Immigrants | Barbados
0.2
/100
|
#260
Tragic
5.6%
South Americans
0.2
/100
|
#261
Tragic
5.6%
Immigrants | St. Vincent and the Grenadines
0.2
/100
|
#262
Tragic
5.6%
Immigrants | Jamaica
0.2
/100
|
#263
Tragic
5.6%

Demographics Similar to Lithuanians by Unemployment Among Ages 65 to 74 years

In terms of unemployment among ages 65 to 74 years, the demographic groups most similar to Lithuanians are Russian (5.4%, a difference of 0.070%), Nonimmigrants (5.4%, a difference of 0.070%), Immigrants from Senegal (5.4%, a difference of 0.10%), Immigrants from Europe (5.4%, a difference of 0.14%), and Immigrants from Africa (5.4%, a difference of 0.16%).
DemographicsRating | RankUnemployment Among Ages 65 to 74 years
Guamanians/Chamorros
42.1
/100
|
#179
Average
5.4%
Immigrants | Ireland
42.0
/100
|
#180
Average
5.4%
Soviet Union
40.0
/100
|
#181
Fair
5.4%
Spanish Americans
38.2
/100
|
#182
Fair
5.4%
Immigrants | Spain
37.3
/100
|
#183
Fair
5.4%
Immigrants | Senegal
35.2
/100
|
#184
Fair
5.4%
Russians
34.4
/100
|
#185
Fair
5.4%
Lithuanians
32.4
/100
|
#186
Fair
5.4%
Immigrants | Nonimmigrants
30.6
/100
|
#187
Fair
5.4%
Immigrants | Europe
28.8
/100
|
#188
Fair
5.4%
Immigrants | Africa
28.3
/100
|
#189
Fair
5.4%
Basques
26.6
/100
|
#190
Fair
5.4%
Immigrants | Egypt
26.5
/100
|
#191
Fair
5.4%
Maltese
26.4
/100
|
#192
Fair
5.4%
Cherokee
25.8
/100
|
#193
Fair
5.4%