Immigrants from Hong Kong vs Spanish American Unemployment Among Ages 65 to 74 years

COMPARE

Immigrants from Hong Kong
Race
Ancestry
AfghanAfricanAlaska NativeAlaskan AthabascanAlbanianAleutAlsatianAmericanApacheArabArapahoArgentineanArmenianAssyrian/Chaldean/SyriacAustralianAustrianBahamianBangladeshiBarbadianBasqueBelgianBelizeanBermudanBhutaneseBlackfeetBolivianBrazilianBritishBritish West IndianBulgarianBurmeseCajunCambodianCanadianCape VerdeanCarpatho RusynCelticCentral AmericanCentral American IndianCherokeeCheyenneChickasawChileanChineseChippewaChoctawColombianColvilleComancheCosta RicanCreeCreekCroatianCrowCubanCypriotCzechCzechoslovakianDanishDelawareDominicanDutchDutch West IndianEastern EuropeanEcuadorianEgyptianEnglishEstonianEthiopianEuropeanFijianFilipinoFinnishFrenchFrench American IndianFrench CanadianGermanGerman RussianGhanaianGreekGuamanian/ChamorroGuatemalanGuyaneseHaitianHmongHonduranHopiHoumaHungarianIcelanderIndian (Asian)IndonesianInupiatIranianIraqiIrishIroquoisIsraeliItalianJamaicanJapaneseJordanianKenyanKiowaKoreanLaotianLatvianLebaneseLiberianLithuanianLumbeeLuxembourgerMacedonianMalaysianMalteseMarshalleseMenomineeMexicanMexican American IndianMongolianMoroccanNative HawaiianNavajoNepaleseNew ZealanderNicaraguanNigerianNorthern EuropeanNorwegianOkinawanOsageOttawaPaiutePakistaniPalestinianPanamanianParaguayanPennsylvania GermanPeruvianPimaPolishPortuguesePotawatomiPuebloPuerto RicanPuget Sound SalishRomanianRussianSalvadoranSamoanScandinavianScotch-IrishScottishSeminoleSenegaleseSerbianShoshoneSierra LeoneanSiouxSlavicSlovakSloveneSomaliSouth AfricanSouth AmericanSouth American IndianSoviet UnionSpaniardSpanishSpanish American IndianSri LankanSubsaharan AfricanSudaneseSwedishSwissSyrianTaiwaneseThaiTlingit-HaidaTohono O'OdhamTonganTrinidadian and TobagonianTsimshianTurkishU.S. Virgin IslanderUgandanUkrainianUruguayanUteVenezuelanVietnameseWelshWest IndianYakamaYaquiYugoslavianYumanYup'ikZimbabwean
Immigration
NonimmigrantsImmigrantsAfghanistanAfricaAlbaniaArgentinaArmeniaAsiaAustraliaAustriaBahamasBangladeshBarbadosBelarusBelgiumBelizeBoliviaBosnia and HerzegovinaBrazilBulgariaBurma/MyanmarCabo VerdeCambodiaCameroonCanadaCaribbeanCentral AmericaChileChinaColombiaCongoCosta RicaCroatiaCubaCzechoslovakiaDenmarkDominicaDominican RepublicEastern AfricaEastern AsiaEastern EuropeEcuadorEgyptEl SalvadorEnglandEritreaEthiopiaEuropeFijiFranceGermanyGhanaGreeceGrenadaGuatemalaGuyanaHaitiHondurasHong KongHungaryIndiaIndonesiaIranIraqIrelandIsraelItalyJamaicaJapanJordanKazakhstanKenyaKoreaKuwaitLaosLatin AmericaLatviaLebanonLiberiaLithuaniaMalaysiaMexicoMicronesiaMiddle AfricaMoldovaMoroccoNepalNetherlandsNicaraguaNigeriaNorth AmericaNorth MacedoniaNorthern AfricaNorthern EuropeNorwayOceaniaPakistanPanamaPeruPhilippinesPolandPortugalRomaniaRussiaSaudi ArabiaScotlandSenegalSerbiaSierra LeoneSingaporeSomaliaSouth AfricaSouth AmericaSouth Central AsiaSouth Eastern AsiaSouthern EuropeSpainSri LankaSt. Vincent and the GrenadinesSudanSwedenSwitzerlandSyriaTaiwanThailandTrinidad and TobagoTurkeyUgandaUkraineUruguayUzbekistanVenezuelaVietnamWest IndiesWestern AfricaWestern AsiaWestern EuropeYemenZaireZimbabweAzores
Spanish American
Race
Ancestry
AfghanAfricanAlaska NativeAlaskan AthabascanAlbanianAleutAlsatianAmericanApacheArabArapahoArgentineanArmenianAssyrian/Chaldean/SyriacAustralianAustrianBahamianBangladeshiBarbadianBasqueBelgianBelizeanBermudanBhutaneseBlackfeetBolivianBrazilianBritishBritish West IndianBulgarianBurmeseCajunCambodianCanadianCape VerdeanCarpatho RusynCelticCentral AmericanCentral American IndianCherokeeCheyenneChickasawChileanChineseChippewaChoctawColombianColvilleComancheCosta RicanCreeCreekCroatianCrowCubanCypriotCzechCzechoslovakianDanishDelawareDominicanDutchDutch West IndianEastern EuropeanEcuadorianEgyptianEnglishEstonianEthiopianEuropeanFijianFilipinoFinnishFrenchFrench American IndianFrench CanadianGermanGerman RussianGhanaianGreekGuamanian/ChamorroGuatemalanGuyaneseHaitianHmongHonduranHopiHoumaHungarianIcelanderIndian (Asian)IndonesianInupiatIranianIraqiIrishIroquoisIsraeliItalianJamaicanJapaneseJordanianKenyanKiowaKoreanLaotianLatvianLebaneseLiberianLithuanianLumbeeLuxembourgerMacedonianMalaysianMalteseMarshalleseMenomineeMexicanMexican American IndianMongolianMoroccanNative HawaiianNavajoNepaleseNew ZealanderNicaraguanNigerianNorthern EuropeanNorwegianOkinawanOsageOttawaPaiutePakistaniPalestinianPanamanianParaguayanPennsylvania GermanPeruvianPimaPolishPortuguesePotawatomiPuebloPuerto RicanPuget Sound SalishRomanianRussianSalvadoranSamoanScandinavianScotch-IrishScottishSeminoleSenegaleseSerbianShoshoneSierra LeoneanSiouxSlavicSlovakSloveneSomaliSouth AfricanSouth AmericanSouth American IndianSoviet UnionSpaniardSpanishSpanish AmericanSpanish American IndianSri LankanSubsaharan AfricanSudaneseSwedishSwissSyrianTaiwaneseThaiTlingit-HaidaTohono O'OdhamTonganTrinidadian and TobagonianTsimshianTurkishU.S. Virgin IslanderUgandanUkrainianUruguayanUteVenezuelanVietnameseWelshWest IndianYakamaYaquiYugoslavianYumanYup'ikZimbabwean
Immigration
NonimmigrantsImmigrantsAfghanistanAfricaAlbaniaArgentinaArmeniaAsiaAustraliaAustriaBahamasBangladeshBarbadosBelarusBelgiumBelizeBoliviaBosnia and HerzegovinaBrazilBulgariaBurma/MyanmarCabo VerdeCambodiaCameroonCanadaCaribbeanCentral AmericaChileChinaColombiaCongoCosta RicaCroatiaCubaCzechoslovakiaDenmarkDominicaDominican RepublicEastern AfricaEastern AsiaEastern EuropeEcuadorEgyptEl SalvadorEnglandEritreaEthiopiaEuropeFijiFranceGermanyGhanaGreeceGrenadaGuatemalaGuyanaHaitiHondurasHungaryIndiaIndonesiaIranIraqIrelandIsraelItalyJamaicaJapanJordanKazakhstanKenyaKoreaKuwaitLaosLatin AmericaLatviaLebanonLiberiaLithuaniaMalaysiaMexicoMicronesiaMiddle AfricaMoldovaMoroccoNepalNetherlandsNicaraguaNigeriaNorth AmericaNorth MacedoniaNorthern AfricaNorthern EuropeNorwayOceaniaPakistanPanamaPeruPhilippinesPolandPortugalRomaniaRussiaSaudi ArabiaScotlandSenegalSerbiaSierra LeoneSingaporeSomaliaSouth AfricaSouth AmericaSouth Central AsiaSouth Eastern AsiaSouthern EuropeSpainSri LankaSt. Vincent and the GrenadinesSudanSwedenSwitzerlandSyriaTaiwanThailandTrinidad and TobagoTurkeyUgandaUkraineUruguayUzbekistanVenezuelaVietnamWest IndiesWestern AfricaWestern AsiaWestern EuropeYemenZaireZimbabweAzores
Unemployment Among Ages 65 to 74 years
Income
Poverty
Unemployment
Labor Participation
Family Structure
Vehicle Availability
Education Level
Disability

Unemployment Among Ages 65 to 74 years Comparison

Immigrants from Hong Kong

Spanish Americans

Excellent
Fair
5.3%
UNEMPLOYMENT AMONG AGES 65 TO 74 YEARS
86.5/ 100
METRIC RATING
128th/ 347
METRIC RANK
5.4%
UNEMPLOYMENT AMONG AGES 65 TO 74 YEARS
38.2/ 100
METRIC RATING
182nd/ 347
METRIC RANK

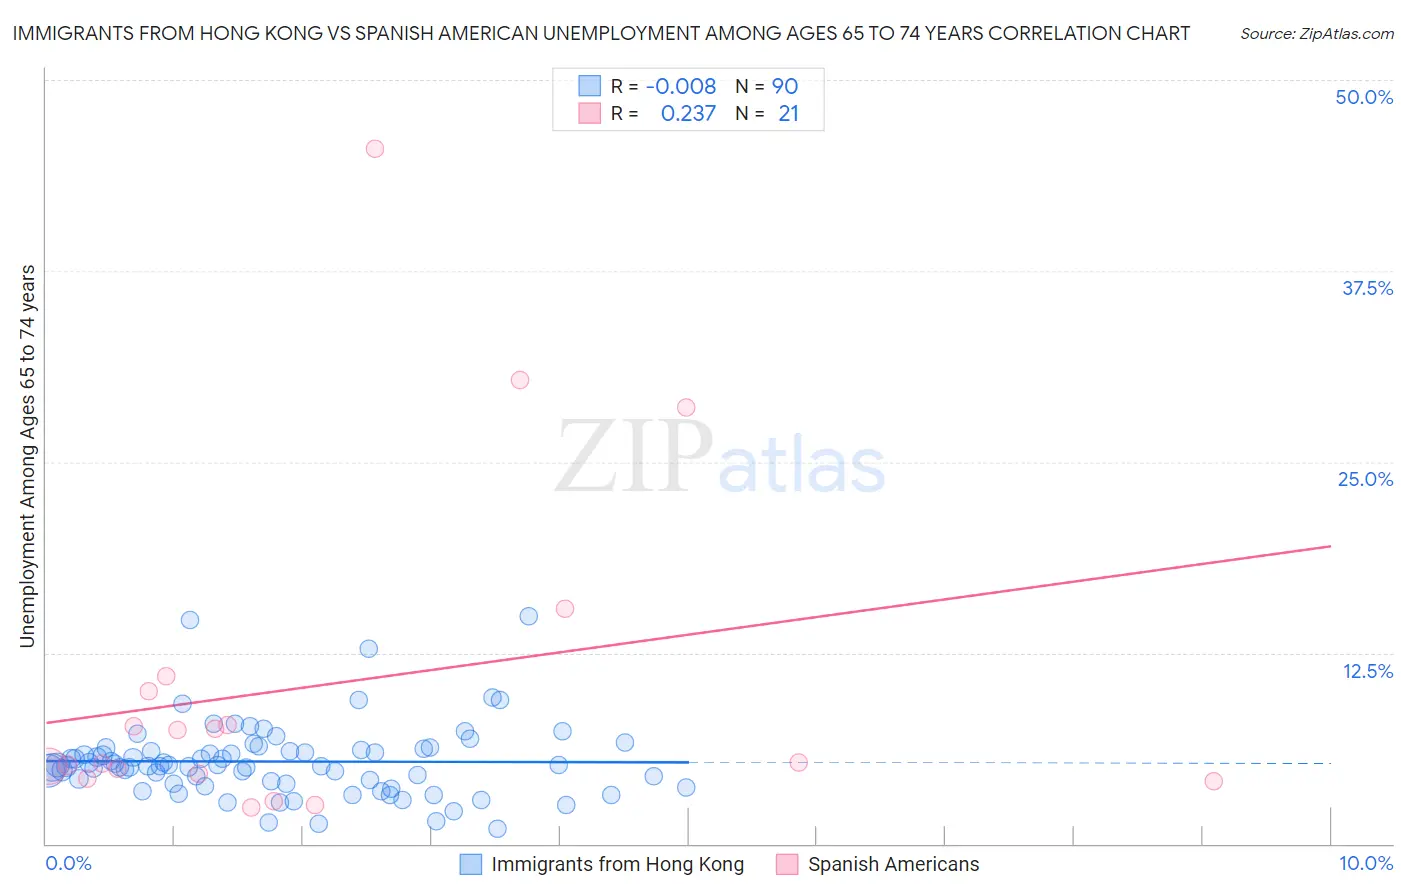
Immigrants from Hong Kong vs Spanish American Unemployment Among Ages 65 to 74 years Correlation Chart

The statistical analysis conducted on geographies consisting of 236,925,939 people shows no correlation between the proportion of Immigrants from Hong Kong and unemployment rate among population between the ages 65 and 74 in the United States with a correlation coefficient (R) of -0.008 and weighted average of 5.3%. Similarly, the statistical analysis conducted on geographies consisting of 98,707,730 people shows a weak positive correlation between the proportion of Spanish Americans and unemployment rate among population between the ages 65 and 74 in the United States with a correlation coefficient (R) of 0.237 and weighted average of 5.4%, a difference of 2.0%.
Immigrants from Hong Kong vs Spanish American Unemployment Among Ages 65 to 74 years

Unemployment Among Ages 65 to 74 years Correlation Summary

MeasurementImmigrants from Hong KongSpanish American
Minimum1.0%2.4%
Maximum14.9%45.5%
Range13.9%43.1%
Mean5.4%10.4%
Median5.1%5.3%
Interquartile 25% (IQ1)3.9%4.4%
Interquartile 75% (IQ3)6.1%10.5%
Interquartile Range (IQR)2.2%6.1%
Standard Deviation (Sample)2.4%11.1%
Standard Deviation (Population)2.4%10.8%

Similar Demographics by Unemployment Among Ages 65 to 74 years

Demographics Similar to Immigrants from Hong Kong by Unemployment Among Ages 65 to 74 years

In terms of unemployment among ages 65 to 74 years, the demographic groups most similar to Immigrants from Hong Kong are Immigrants from North America (5.3%, a difference of 0.010%), Immigrants from England (5.3%, a difference of 0.030%), Immigrants from South Eastern Asia (5.3%, a difference of 0.050%), Pakistani (5.3%, a difference of 0.070%), and Eastern European (5.3%, a difference of 0.070%).
DemographicsRating | RankUnemployment Among Ages 65 to 74 years
Immigrants | Australia
89.1
/100
|
#121
Excellent
5.3%
Immigrants | Canada
89.0
/100
|
#122
Excellent
5.3%
Czechoslovakians
88.6
/100
|
#123
Excellent
5.3%
Immigrants | Ukraine
87.5
/100
|
#124
Excellent
5.3%
Pakistanis
87.5
/100
|
#125
Excellent
5.3%
Immigrants | South Eastern Asia
87.2
/100
|
#126
Excellent
5.3%
Immigrants | North America
86.7
/100
|
#127
Excellent
5.3%
Immigrants | Hong Kong
86.5
/100
|
#128
Excellent
5.3%
Immigrants | England
86.2
/100
|
#129
Excellent
5.3%
Eastern Europeans
85.6
/100
|
#130
Excellent
5.3%
Immigrants | Russia
83.0
/100
|
#131
Excellent
5.3%
Koreans
82.6
/100
|
#132
Excellent
5.3%
Ukrainians
82.0
/100
|
#133
Excellent
5.3%
Immigrants | Panama
81.8
/100
|
#134
Excellent
5.3%
Immigrants | Serbia
81.8
/100
|
#135
Excellent
5.3%

Demographics Similar to Spanish Americans by Unemployment Among Ages 65 to 74 years

In terms of unemployment among ages 65 to 74 years, the demographic groups most similar to Spanish Americans are Immigrants from Spain (5.4%, a difference of 0.030%), Soviet Union (5.4%, a difference of 0.060%), Immigrants from Senegal (5.4%, a difference of 0.11%), Immigrants from Ireland (5.4%, a difference of 0.13%), and Guamanian/Chamorro (5.4%, a difference of 0.14%).
DemographicsRating | RankUnemployment Among Ages 65 to 74 years
Immigrants | Iran
49.0
/100
|
#175
Average
5.4%
Immigrants | Western Europe
47.3
/100
|
#176
Average
5.4%
Arabs
46.8
/100
|
#177
Average
5.4%
French
43.1
/100
|
#178
Average
5.4%
Guamanians/Chamorros
42.1
/100
|
#179
Average
5.4%
Immigrants | Ireland
42.0
/100
|
#180
Average
5.4%
Soviet Union
40.0
/100
|
#181
Fair
5.4%
Spanish Americans
38.2
/100
|
#182
Fair
5.4%
Immigrants | Spain
37.3
/100
|
#183
Fair
5.4%
Immigrants | Senegal
35.2
/100
|
#184
Fair
5.4%
Russians
34.4
/100
|
#185
Fair
5.4%
Lithuanians
32.4
/100
|
#186
Fair
5.4%
Immigrants | Nonimmigrants
30.6
/100
|
#187
Fair
5.4%
Immigrants | Europe
28.8
/100
|
#188
Fair
5.4%
Immigrants | Africa
28.3
/100
|
#189
Fair
5.4%