Menominee vs Immigrants from Bahamas Unemployment Among Ages 16 to 19 years
COMPARE
Menominee
Immigrants from Bahamas
Unemployment Among Ages 16 to 19 years
Unemployment Among Ages 16 to 19 years Comparison
Menominee
Immigrants from Bahamas
16.6%
UNEMPLOYMENT AMONG AGES 16 TO 19 YEARS
99.3/ 100
METRIC RATING
60th/ 347
METRIC RANK
20.4%
UNEMPLOYMENT AMONG AGES 16 TO 19 YEARS
0.0/ 100
METRIC RATING
293rd/ 347
METRIC RANK
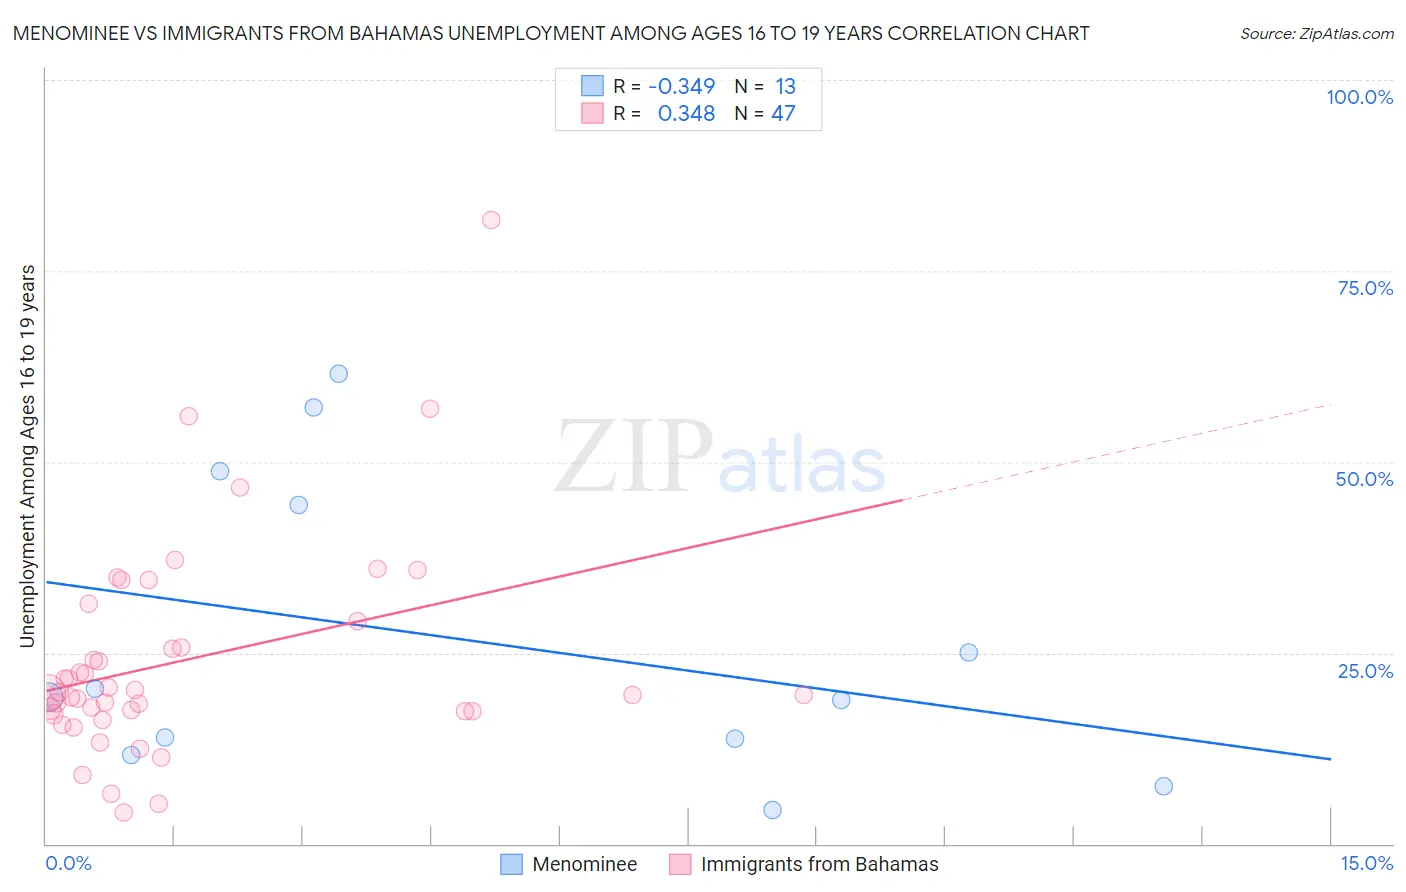
Menominee vs Immigrants from Bahamas Unemployment Among Ages 16 to 19 years Correlation Chart
The statistical analysis conducted on geographies consisting of 45,021,333 people shows a mild negative correlation between the proportion of Menominee and unemployment rate among population between the ages 16 and 19 in the United States with a correlation coefficient (R) of -0.349 and weighted average of 16.6%. Similarly, the statistical analysis conducted on geographies consisting of 102,900,667 people shows a mild positive correlation between the proportion of Immigrants from Bahamas and unemployment rate among population between the ages 16 and 19 in the United States with a correlation coefficient (R) of 0.348 and weighted average of 20.4%, a difference of 23.1%.
Unemployment Among Ages 16 to 19 years Correlation Summary
| Measurement | Menominee | Immigrants from Bahamas |
| Minimum | 4.4% | 4.1% |
| Maximum | 61.5% | 81.7% |
| Range | 57.1% | 77.6% |
| Mean | 26.6% | 24.0% |
| Median | 19.2% | 19.8% |
| Interquartile 25% (IQ1) | 12.7% | 17.3% |
| Interquartile 75% (IQ3) | 46.6% | 29.2% |
| Interquartile Range (IQR) | 33.9% | 11.9% |
| Standard Deviation (Sample) | 19.4% | 14.2% |
| Standard Deviation (Population) | 18.7% | 14.0% |
Similar Demographics by Unemployment Among Ages 16 to 19 years
Demographics Similar to Menominee by Unemployment Among Ages 16 to 19 years
In terms of unemployment among ages 16 to 19 years, the demographic groups most similar to Menominee are Immigrants from Cuba (16.6%, a difference of 0.060%), Macedonian (16.6%, a difference of 0.16%), Irish (16.5%, a difference of 0.17%), Immigrants from Uganda (16.5%, a difference of 0.22%), and Immigrants from Jordan (16.5%, a difference of 0.27%).
| Demographics | Rating | Rank | Unemployment Among Ages 16 to 19 years |
| Slovenes | 99.6 /100 | #53 | Exceptional 16.4% |
| British | 99.5 /100 | #54 | Exceptional 16.5% |
| Czechoslovakians | 99.5 /100 | #55 | Exceptional 16.5% |
| Sri Lankans | 99.5 /100 | #56 | Exceptional 16.5% |
| Immigrants | Jordan | 99.4 /100 | #57 | Exceptional 16.5% |
| Immigrants | Uganda | 99.4 /100 | #58 | Exceptional 16.5% |
| Irish | 99.4 /100 | #59 | Exceptional 16.5% |
| Menominee | 99.3 /100 | #60 | Exceptional 16.6% |
| Immigrants | Cuba | 99.2 /100 | #61 | Exceptional 16.6% |
| Macedonians | 99.2 /100 | #62 | Exceptional 16.6% |
| Scotch-Irish | 99.1 /100 | #63 | Exceptional 16.6% |
| Northern Europeans | 99.0 /100 | #64 | Exceptional 16.6% |
| Immigrants | Japan | 98.9 /100 | #65 | Exceptional 16.6% |
| Okinawans | 98.9 /100 | #66 | Exceptional 16.6% |
| Slavs | 98.7 /100 | #67 | Exceptional 16.7% |
Demographics Similar to Immigrants from Bahamas by Unemployment Among Ages 16 to 19 years
In terms of unemployment among ages 16 to 19 years, the demographic groups most similar to Immigrants from Bahamas are Immigrants from Haiti (20.4%, a difference of 0.26%), Central American Indian (20.4%, a difference of 0.32%), Armenian (20.5%, a difference of 0.61%), Comanche (20.2%, a difference of 0.63%), and Alsatian (20.5%, a difference of 0.64%).
| Demographics | Rating | Rank | Unemployment Among Ages 16 to 19 years |
| Bahamians | 0.0 /100 | #286 | Tragic 19.8% |
| Immigrants | Ghana | 0.0 /100 | #287 | Tragic 19.8% |
| Immigrants | Azores | 0.0 /100 | #288 | Tragic 19.8% |
| Pueblo | 0.0 /100 | #289 | Tragic 19.8% |
| Immigrants | Sierra Leone | 0.0 /100 | #290 | Tragic 20.0% |
| Immigrants | Yemen | 0.0 /100 | #291 | Tragic 20.0% |
| Comanche | 0.0 /100 | #292 | Tragic 20.2% |
| Immigrants | Bahamas | 0.0 /100 | #293 | Tragic 20.4% |
| Immigrants | Haiti | 0.0 /100 | #294 | Tragic 20.4% |
| Central American Indians | 0.0 /100 | #295 | Tragic 20.4% |
| Armenians | 0.0 /100 | #296 | Tragic 20.5% |
| Alsatians | 0.0 /100 | #297 | Tragic 20.5% |
| Haitians | 0.0 /100 | #298 | Tragic 20.5% |
| Immigrants | Uzbekistan | 0.0 /100 | #299 | Tragic 20.5% |
| Ecuadorians | 0.0 /100 | #300 | Tragic 20.5% |