Menominee vs Immigrants from Bahamas Divorced or Separated
COMPARE
Menominee
Immigrants from Bahamas
Divorced or Separated
Divorced or Separated Comparison
Menominee
Immigrants from Bahamas
11.8%
DIVORCED OR SEPARATED
93.8/ 100
METRIC RATING
122nd/ 347
METRIC RANK
13.9%
DIVORCED OR SEPARATED
0.0/ 100
METRIC RATING
334th/ 347
METRIC RANK
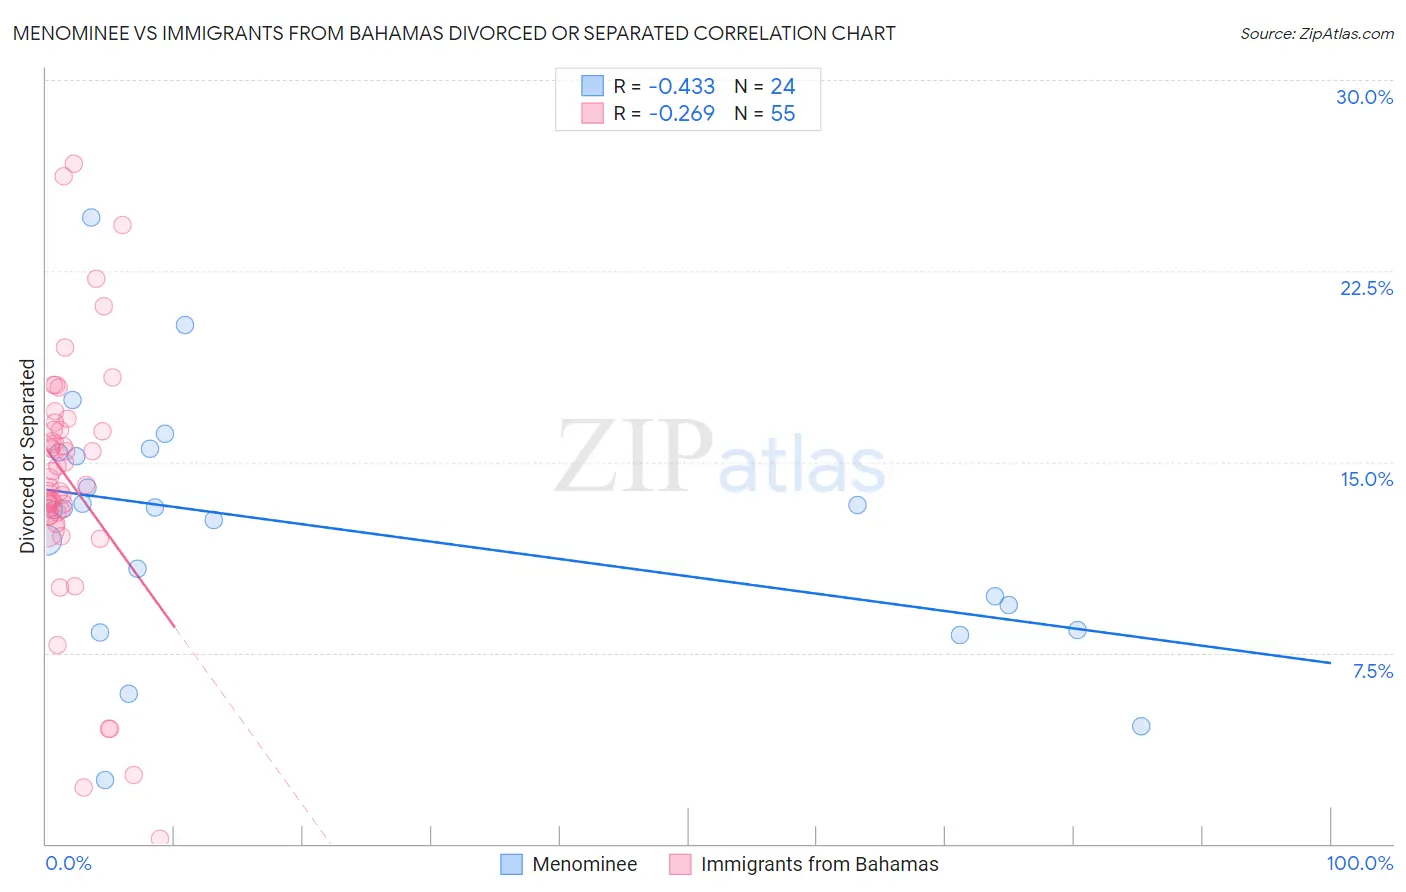
Menominee vs Immigrants from Bahamas Divorced or Separated Correlation Chart
The statistical analysis conducted on geographies consisting of 45,778,710 people shows a moderate negative correlation between the proportion of Menominee and percentage of population currently divorced or separated in the United States with a correlation coefficient (R) of -0.433 and weighted average of 11.8%. Similarly, the statistical analysis conducted on geographies consisting of 104,629,880 people shows a weak negative correlation between the proportion of Immigrants from Bahamas and percentage of population currently divorced or separated in the United States with a correlation coefficient (R) of -0.269 and weighted average of 13.9%, a difference of 18.1%.
Divorced or Separated Correlation Summary
| Measurement | Menominee | Immigrants from Bahamas |
| Minimum | 2.5% | 0.20% |
| Maximum | 24.6% | 26.7% |
| Range | 22.1% | 26.5% |
| Mean | 12.4% | 14.3% |
| Median | 13.1% | 14.1% |
| Interquartile 25% (IQ1) | 8.9% | 12.9% |
| Interquartile 75% (IQ3) | 15.3% | 16.3% |
| Interquartile Range (IQR) | 6.4% | 3.3% |
| Standard Deviation (Sample) | 4.9% | 5.1% |
| Standard Deviation (Population) | 4.8% | 5.1% |
Similar Demographics by Divorced or Separated
Demographics Similar to Menominee by Divorced or Separated
In terms of divorced or separated, the demographic groups most similar to Menominee are Immigrants (11.8%, a difference of 0.020%), Ugandan (11.8%, a difference of 0.090%), Romanian (11.8%, a difference of 0.12%), Iraqi (11.8%, a difference of 0.13%), and Ukrainian (11.8%, a difference of 0.20%).
| Demographics | Rating | Rank | Divorced or Separated |
| Lithuanians | 95.7 /100 | #115 | Exceptional 11.7% |
| Immigrants | Iraq | 95.4 /100 | #116 | Exceptional 11.7% |
| Immigrants | Uganda | 95.3 /100 | #117 | Exceptional 11.7% |
| Ecuadorians | 95.3 /100 | #118 | Exceptional 11.7% |
| Syrians | 95.1 /100 | #119 | Exceptional 11.7% |
| Iraqis | 94.6 /100 | #120 | Exceptional 11.8% |
| Romanians | 94.5 /100 | #121 | Exceptional 11.8% |
| Menominee | 93.8 /100 | #122 | Exceptional 11.8% |
| Immigrants | Immigrants | 93.7 /100 | #123 | Exceptional 11.8% |
| Ugandans | 93.1 /100 | #124 | Exceptional 11.8% |
| Ukrainians | 92.3 /100 | #125 | Exceptional 11.8% |
| South American Indians | 92.1 /100 | #126 | Exceptional 11.8% |
| South Africans | 88.9 /100 | #127 | Excellent 11.8% |
| Immigrants | Ecuador | 88.9 /100 | #128 | Excellent 11.8% |
| Immigrants | St. Vincent and the Grenadines | 88.4 /100 | #129 | Excellent 11.8% |
Demographics Similar to Immigrants from Bahamas by Divorced or Separated
In terms of divorced or separated, the demographic groups most similar to Immigrants from Bahamas are Puerto Rican (13.9%, a difference of 0.34%), Dutch West Indian (14.0%, a difference of 0.60%), Shoshone (14.0%, a difference of 0.95%), Crow (14.1%, a difference of 1.2%), and Cherokee (13.7%, a difference of 1.3%).
| Demographics | Rating | Rank | Divorced or Separated |
| Comanche | 0.0 /100 | #327 | Tragic 13.5% |
| Immigrants | Caribbean | 0.0 /100 | #328 | Tragic 13.6% |
| Houma | 0.0 /100 | #329 | Tragic 13.6% |
| Paiute | 0.0 /100 | #330 | Tragic 13.6% |
| Blacks/African Americans | 0.0 /100 | #331 | Tragic 13.6% |
| Cherokee | 0.0 /100 | #332 | Tragic 13.7% |
| Puerto Ricans | 0.0 /100 | #333 | Tragic 13.9% |
| Immigrants | Bahamas | 0.0 /100 | #334 | Tragic 13.9% |
| Dutch West Indians | 0.0 /100 | #335 | Tragic 14.0% |
| Shoshone | 0.0 /100 | #336 | Tragic 14.0% |
| Crow | 0.0 /100 | #337 | Tragic 14.1% |
| Choctaw | 0.0 /100 | #338 | Tragic 14.1% |
| Colville | 0.0 /100 | #339 | Tragic 14.2% |
| Chickasaw | 0.0 /100 | #340 | Tragic 14.2% |
| Bahamians | 0.0 /100 | #341 | Tragic 14.2% |