Menominee vs Mexican American Indian Unemployment Among Ages 16 to 19 years
COMPARE
Menominee
Mexican American Indian
Unemployment Among Ages 16 to 19 years
Unemployment Among Ages 16 to 19 years Comparison
Menominee
Mexican American Indians
16.6%
UNEMPLOYMENT AMONG AGES 16 TO 19 YEARS
99.3/ 100
METRIC RATING
60th/ 347
METRIC RANK
18.8%
UNEMPLOYMENT AMONG AGES 16 TO 19 YEARS
0.3/ 100
METRIC RATING
256th/ 347
METRIC RANK
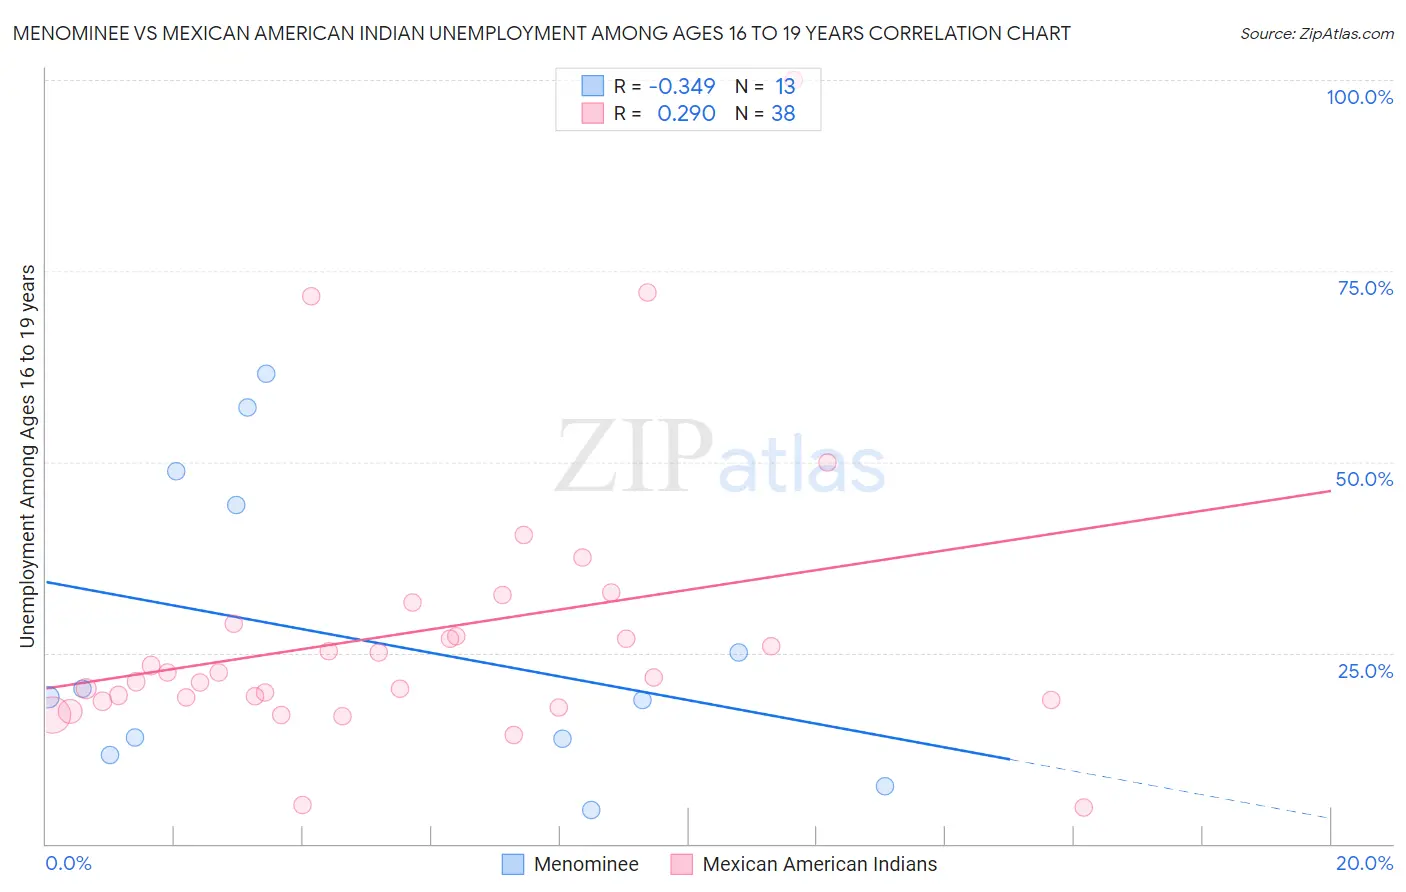
Menominee vs Mexican American Indian Unemployment Among Ages 16 to 19 years Correlation Chart
The statistical analysis conducted on geographies consisting of 45,021,333 people shows a mild negative correlation between the proportion of Menominee and unemployment rate among population between the ages 16 and 19 in the United States with a correlation coefficient (R) of -0.349 and weighted average of 16.6%. Similarly, the statistical analysis conducted on geographies consisting of 306,565,070 people shows a weak positive correlation between the proportion of Mexican American Indians and unemployment rate among population between the ages 16 and 19 in the United States with a correlation coefficient (R) of 0.290 and weighted average of 18.8%, a difference of 13.7%.
Unemployment Among Ages 16 to 19 years Correlation Summary
| Measurement | Menominee | Mexican American Indian |
| Minimum | 4.4% | 4.8% |
| Maximum | 61.5% | 100.0% |
| Range | 57.1% | 95.2% |
| Mean | 26.6% | 27.7% |
| Median | 19.2% | 22.0% |
| Interquartile 25% (IQ1) | 12.7% | 18.8% |
| Interquartile 75% (IQ3) | 46.6% | 28.8% |
| Interquartile Range (IQR) | 33.9% | 10.0% |
| Standard Deviation (Sample) | 19.4% | 18.4% |
| Standard Deviation (Population) | 18.7% | 18.1% |
Similar Demographics by Unemployment Among Ages 16 to 19 years
Demographics Similar to Menominee by Unemployment Among Ages 16 to 19 years
In terms of unemployment among ages 16 to 19 years, the demographic groups most similar to Menominee are Immigrants from Cuba (16.6%, a difference of 0.060%), Macedonian (16.6%, a difference of 0.16%), Irish (16.5%, a difference of 0.17%), Immigrants from Uganda (16.5%, a difference of 0.22%), and Immigrants from Jordan (16.5%, a difference of 0.27%).
| Demographics | Rating | Rank | Unemployment Among Ages 16 to 19 years |
| Slovenes | 99.6 /100 | #53 | Exceptional 16.4% |
| British | 99.5 /100 | #54 | Exceptional 16.5% |
| Czechoslovakians | 99.5 /100 | #55 | Exceptional 16.5% |
| Sri Lankans | 99.5 /100 | #56 | Exceptional 16.5% |
| Immigrants | Jordan | 99.4 /100 | #57 | Exceptional 16.5% |
| Immigrants | Uganda | 99.4 /100 | #58 | Exceptional 16.5% |
| Irish | 99.4 /100 | #59 | Exceptional 16.5% |
| Menominee | 99.3 /100 | #60 | Exceptional 16.6% |
| Immigrants | Cuba | 99.2 /100 | #61 | Exceptional 16.6% |
| Macedonians | 99.2 /100 | #62 | Exceptional 16.6% |
| Scotch-Irish | 99.1 /100 | #63 | Exceptional 16.6% |
| Northern Europeans | 99.0 /100 | #64 | Exceptional 16.6% |
| Immigrants | Japan | 98.9 /100 | #65 | Exceptional 16.6% |
| Okinawans | 98.9 /100 | #66 | Exceptional 16.6% |
| Slavs | 98.7 /100 | #67 | Exceptional 16.7% |
Demographics Similar to Mexican American Indians by Unemployment Among Ages 16 to 19 years
In terms of unemployment among ages 16 to 19 years, the demographic groups most similar to Mexican American Indians are Immigrants from Cameroon (18.8%, a difference of 0.070%), Apache (18.8%, a difference of 0.080%), Central American (18.8%, a difference of 0.11%), Immigrants from Nigeria (18.9%, a difference of 0.26%), and Immigrants from Mexico (18.9%, a difference of 0.40%).
| Demographics | Rating | Rank | Unemployment Among Ages 16 to 19 years |
| Puget Sound Salish | 0.5 /100 | #249 | Tragic 18.7% |
| Panamanians | 0.4 /100 | #250 | Tragic 18.7% |
| Sub-Saharan Africans | 0.4 /100 | #251 | Tragic 18.7% |
| Immigrants | Guatemala | 0.4 /100 | #252 | Tragic 18.7% |
| Central Americans | 0.3 /100 | #253 | Tragic 18.8% |
| Apache | 0.3 /100 | #254 | Tragic 18.8% |
| Immigrants | Cameroon | 0.3 /100 | #255 | Tragic 18.8% |
| Mexican American Indians | 0.3 /100 | #256 | Tragic 18.8% |
| Immigrants | Nigeria | 0.2 /100 | #257 | Tragic 18.9% |
| Immigrants | Mexico | 0.2 /100 | #258 | Tragic 18.9% |
| Immigrants | Central America | 0.2 /100 | #259 | Tragic 18.9% |
| Nigerians | 0.2 /100 | #260 | Tragic 18.9% |
| Spanish American Indians | 0.1 /100 | #261 | Tragic 18.9% |
| Salvadorans | 0.1 /100 | #262 | Tragic 18.9% |
| Cree | 0.1 /100 | #263 | Tragic 19.0% |