Immigrants from Ukraine vs Greek Unemployment Among Women with Children Ages 6 to 17 years

COMPARE

Immigrants from Ukraine
Race
Ancestry
AfghanAfricanAlaska NativeAlaskan AthabascanAlbanianAleutAlsatianAmericanApacheArabArapahoArgentineanArmenianAssyrian/Chaldean/SyriacAustralianAustrianBahamianBangladeshiBarbadianBasqueBelgianBelizeanBermudanBhutaneseBlackfeetBolivianBrazilianBritishBritish West IndianBulgarianBurmeseCajunCambodianCanadianCape VerdeanCarpatho RusynCelticCentral AmericanCentral American IndianCherokeeCheyenneChickasawChileanChineseChippewaChoctawColombianColvilleComancheCosta RicanCreeCreekCroatianCrowCubanCypriotCzechCzechoslovakianDanishDelawareDominicanDutchDutch West IndianEastern EuropeanEcuadorianEgyptianEnglishEstonianEthiopianEuropeanFijianFilipinoFinnishFrenchFrench American IndianFrench CanadianGermanGerman RussianGhanaianGuamanian/ChamorroGuatemalanGuyaneseHaitianHmongHonduranHopiHoumaHungarianIcelanderIndian (Asian)IndonesianInupiatIranianIraqiIrishIroquoisIsraeliItalianJamaicanJapaneseJordanianKenyanKiowaKoreanLaotianLatvianLebaneseLiberianLithuanianLumbeeLuxembourgerMacedonianMalaysianMalteseMarshalleseMenomineeMexicanMexican American IndianMongolianMoroccanNative HawaiianNavajoNepaleseNew ZealanderNicaraguanNigerianNorthern EuropeanNorwegianOkinawanOsageOttawaPaiutePakistaniPalestinianPanamanianParaguayanPennsylvania GermanPeruvianPimaPolishPortuguesePotawatomiPuebloPuerto RicanPuget Sound SalishRomanianRussianSalvadoranSamoanScandinavianScotch-IrishScottishSeminoleSenegaleseSerbianShoshoneSierra LeoneanSiouxSlavicSlovakSloveneSomaliSouth AfricanSouth AmericanSouth American IndianSoviet UnionSpaniardSpanishSpanish AmericanSpanish American IndianSri LankanSubsaharan AfricanSudaneseSwedishSwissSyrianTaiwaneseThaiTlingit-HaidaTohono O'OdhamTonganTrinidadian and TobagonianTsimshianTurkishU.S. Virgin IslanderUgandanUkrainianUruguayanUteVenezuelanVietnameseWelshWest IndianYakamaYaquiYugoslavianYumanYup'ikZimbabwean
Immigration
NonimmigrantsImmigrantsAfghanistanAfricaAlbaniaArgentinaArmeniaAsiaAustraliaAustriaBahamasBangladeshBarbadosBelarusBelgiumBelizeBoliviaBosnia and HerzegovinaBrazilBulgariaBurma/MyanmarCabo VerdeCambodiaCameroonCanadaCaribbeanCentral AmericaChileChinaColombiaCongoCosta RicaCroatiaCubaCzechoslovakiaDenmarkDominicaDominican RepublicEastern AfricaEastern AsiaEastern EuropeEcuadorEgyptEl SalvadorEnglandEritreaEthiopiaEuropeFijiFranceGermanyGhanaGreeceGrenadaGuatemalaGuyanaHaitiHondurasHong KongHungaryIndiaIndonesiaIranIraqIrelandIsraelItalyJamaicaJapanJordanKazakhstanKenyaKoreaKuwaitLaosLatin AmericaLatviaLebanonLiberiaLithuaniaMalaysiaMexicoMicronesiaMiddle AfricaMoldovaMoroccoNepalNetherlandsNicaraguaNigeriaNorth AmericaNorth MacedoniaNorthern AfricaNorthern EuropeNorwayOceaniaPakistanPanamaPeruPhilippinesPolandPortugalRomaniaRussiaSaudi ArabiaScotlandSenegalSerbiaSierra LeoneSingaporeSomaliaSouth AfricaSouth AmericaSouth Central AsiaSouth Eastern AsiaSouthern EuropeSpainSri LankaSt. Vincent and the GrenadinesSudanSwedenSwitzerlandSyriaTaiwanThailandTrinidad and TobagoTurkeyUgandaUkraineUruguayUzbekistanVenezuelaVietnamWest IndiesWestern AfricaWestern AsiaWestern EuropeYemenZaireZimbabweAzores
Greek
Race
Ancestry
AfghanAfricanAlaska NativeAlaskan AthabascanAlbanianAleutAlsatianAmericanApacheArabArapahoArgentineanArmenianAssyrian/Chaldean/SyriacAustralianAustrianBahamianBangladeshiBarbadianBasqueBelgianBelizeanBermudanBhutaneseBlackfeetBolivianBrazilianBritishBritish West IndianBulgarianBurmeseCajunCambodianCanadianCape VerdeanCarpatho RusynCelticCentral AmericanCentral American IndianCherokeeCheyenneChickasawChileanChineseChippewaChoctawColombianColvilleComancheCosta RicanCreeCreekCroatianCrowCubanCypriotCzechCzechoslovakianDanishDelawareDominicanDutchDutch West IndianEastern EuropeanEcuadorianEgyptianEnglishEstonianEthiopianEuropeanFijianFilipinoFinnishFrenchFrench American IndianFrench CanadianGermanGerman RussianGhanaianGreekGuamanian/ChamorroGuatemalanGuyaneseHaitianHmongHonduranHopiHoumaHungarianIcelanderIndian (Asian)IndonesianInupiatIranianIraqiIrishIroquoisIsraeliItalianJamaicanJapaneseJordanianKenyanKiowaKoreanLaotianLatvianLebaneseLiberianLithuanianLumbeeLuxembourgerMacedonianMalaysianMalteseMarshalleseMenomineeMexicanMexican American IndianMongolianMoroccanNative HawaiianNavajoNepaleseNew ZealanderNicaraguanNigerianNorthern EuropeanNorwegianOkinawanOsageOttawaPaiutePakistaniPalestinianPanamanianParaguayanPennsylvania GermanPeruvianPimaPolishPortuguesePotawatomiPuebloPuerto RicanPuget Sound SalishRomanianRussianSalvadoranSamoanScandinavianScotch-IrishScottishSeminoleSenegaleseSerbianShoshoneSierra LeoneanSiouxSlavicSlovakSloveneSomaliSouth AfricanSouth AmericanSouth American IndianSoviet UnionSpaniardSpanishSpanish AmericanSpanish American IndianSri LankanSubsaharan AfricanSudaneseSwedishSwissSyrianTaiwaneseThaiTlingit-HaidaTohono O'OdhamTonganTrinidadian and TobagonianTsimshianTurkishU.S. Virgin IslanderUgandanUkrainianUruguayanUteVenezuelanVietnameseWelshWest IndianYakamaYaquiYugoslavianYumanYup'ikZimbabwean
Immigration
NonimmigrantsImmigrantsAfghanistanAfricaAlbaniaArgentinaArmeniaAsiaAustraliaAustriaBahamasBangladeshBarbadosBelarusBelgiumBelizeBoliviaBosnia and HerzegovinaBrazilBulgariaBurma/MyanmarCabo VerdeCambodiaCameroonCanadaCaribbeanCentral AmericaChileChinaColombiaCongoCosta RicaCroatiaCubaCzechoslovakiaDenmarkDominicaDominican RepublicEastern AfricaEastern AsiaEastern EuropeEcuadorEgyptEl SalvadorEnglandEritreaEthiopiaEuropeFijiFranceGermanyGhanaGreeceGrenadaGuatemalaGuyanaHaitiHondurasHong KongHungaryIndiaIndonesiaIranIraqIrelandIsraelItalyJamaicaJapanJordanKazakhstanKenyaKoreaKuwaitLaosLatin AmericaLatviaLebanonLiberiaLithuaniaMalaysiaMexicoMicronesiaMiddle AfricaMoldovaMoroccoNepalNetherlandsNicaraguaNigeriaNorth AmericaNorth MacedoniaNorthern AfricaNorthern EuropeNorwayOceaniaPakistanPanamaPeruPhilippinesPolandPortugalRomaniaRussiaSaudi ArabiaScotlandSenegalSerbiaSierra LeoneSingaporeSomaliaSouth AfricaSouth AmericaSouth Central AsiaSouth Eastern AsiaSouthern EuropeSpainSri LankaSt. Vincent and the GrenadinesSudanSwedenSwitzerlandSyriaTaiwanThailandTrinidad and TobagoTurkeyUgandaUruguayUzbekistanVenezuelaVietnamWest IndiesWestern AfricaWestern AsiaWestern EuropeYemenZaireZimbabweAzores
Unemployment Among Women with Children Ages 6 to 17 years
Income
Poverty
Unemployment
Labor Participation
Family Structure
Vehicle Availability
Education Level
Disability

Unemployment Among Women with Children Ages 6 to 17 years Comparison

Immigrants from Ukraine

Greeks

Exceptional
Good
8.6%
UNEMPLOYMENT AMONG WOMEN WITH CHILDREN AGES 6 TO 17 YEARS
97.4/ 100
METRIC RATING
111th/ 347
METRIC RANK
8.9%
UNEMPLOYMENT AMONG WOMEN WITH CHILDREN AGES 6 TO 17 YEARS
75.2/ 100
METRIC RATING
150th/ 347
METRIC RANK

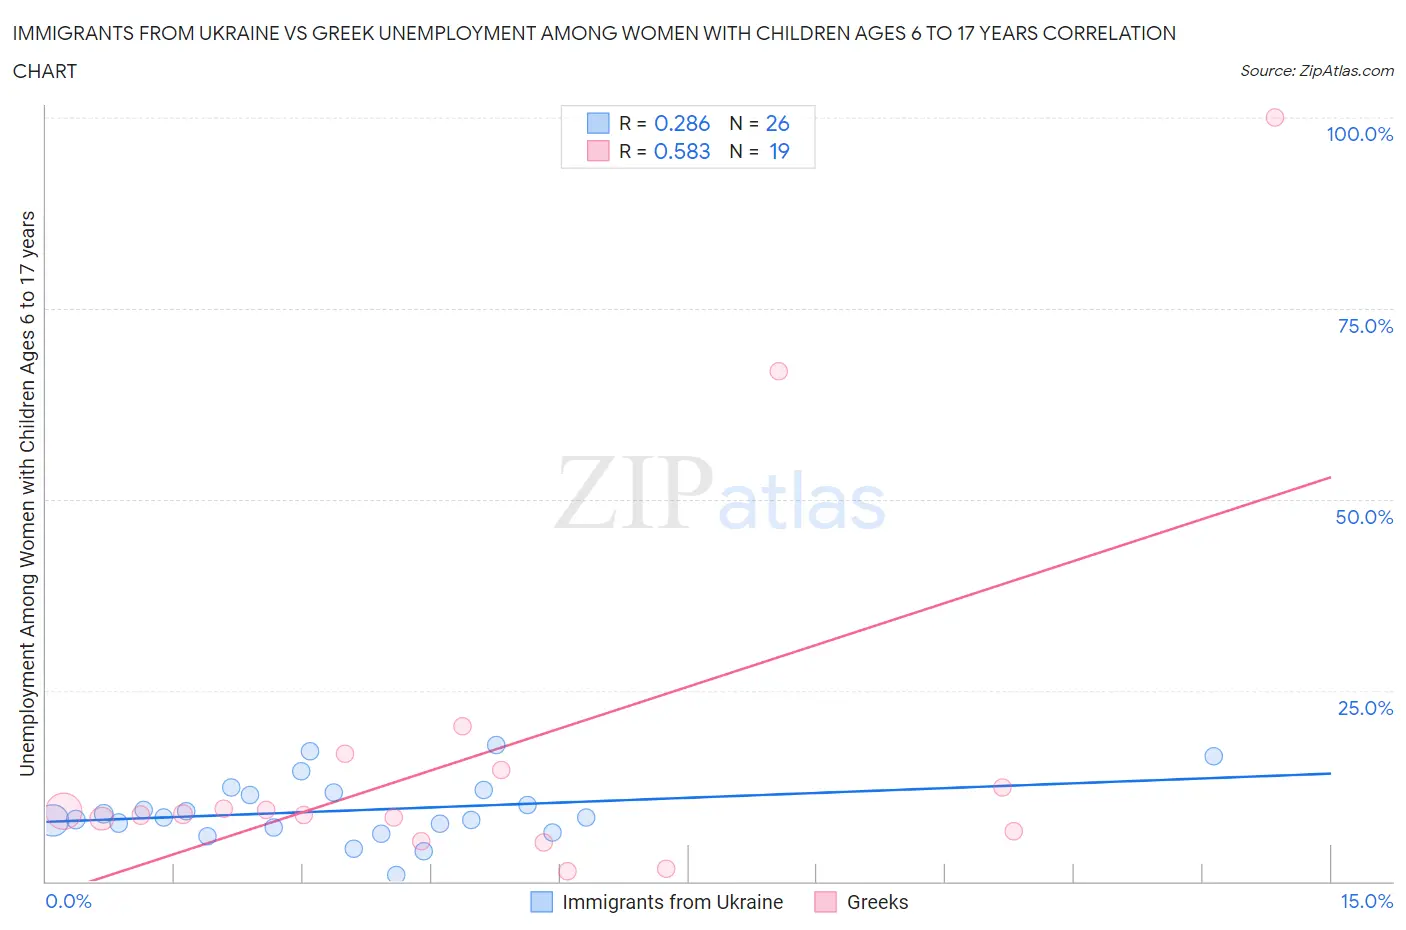
Immigrants from Ukraine vs Greek Unemployment Among Women with Children Ages 6 to 17 years Correlation Chart

The statistical analysis conducted on geographies consisting of 215,687,583 people shows a weak positive correlation between the proportion of Immigrants from Ukraine and unemployment rate among women with children between the ages 6 and 17 in the United States with a correlation coefficient (R) of 0.286 and weighted average of 8.6%. Similarly, the statistical analysis conducted on geographies consisting of 323,893,189 people shows a substantial positive correlation between the proportion of Greeks and unemployment rate among women with children between the ages 6 and 17 in the United States with a correlation coefficient (R) of 0.583 and weighted average of 8.9%, a difference of 2.9%.
Immigrants from Ukraine vs Greek Unemployment Among Women with Children Ages 6 to 17 years

Unemployment Among Women with Children Ages 6 to 17 years Correlation Summary

MeasurementImmigrants from UkraineGreek
Minimum0.80%1.3%
Maximum17.8%100.0%
Range17.0%98.7%
Mean9.3%16.9%
Median8.3%8.8%
Interquartile 25% (IQ1)7.1%6.5%
Interquartile 75% (IQ3)11.6%14.6%
Interquartile Range (IQR)4.5%8.1%
Standard Deviation (Sample)4.0%24.5%
Standard Deviation (Population)4.0%23.8%

Similar Demographics by Unemployment Among Women with Children Ages 6 to 17 years

Demographics Similar to Immigrants from Ukraine by Unemployment Among Women with Children Ages 6 to 17 years

In terms of unemployment among women with children ages 6 to 17 years, the demographic groups most similar to Immigrants from Ukraine are Latvian (8.6%, a difference of 0.010%), Immigrants from Romania (8.6%, a difference of 0.020%), Swedish (8.6%, a difference of 0.090%), Chickasaw (8.6%, a difference of 0.10%), and Romanian (8.6%, a difference of 0.12%).
DemographicsRating | RankUnemployment Among Women with Children Ages 6 to 17 years
Immigrants | France
98.0
/100
|
#104
Exceptional
8.6%
Immigrants | Norway
97.8
/100
|
#105
Exceptional
8.6%
Immigrants | Serbia
97.7
/100
|
#106
Exceptional
8.6%
Chickasaw
97.6
/100
|
#107
Exceptional
8.6%
Swedes
97.6
/100
|
#108
Exceptional
8.6%
Immigrants | Romania
97.5
/100
|
#109
Exceptional
8.6%
Latvians
97.4
/100
|
#110
Exceptional
8.6%
Immigrants | Ukraine
97.4
/100
|
#111
Exceptional
8.6%
Romanians
97.1
/100
|
#112
Exceptional
8.6%
Eastern Europeans
96.8
/100
|
#113
Exceptional
8.6%
Immigrants | Russia
96.7
/100
|
#114
Exceptional
8.6%
Argentineans
96.5
/100
|
#115
Exceptional
8.6%
Zimbabweans
96.3
/100
|
#116
Exceptional
8.6%
Albanians
96.3
/100
|
#117
Exceptional
8.6%
Pueblo
96.2
/100
|
#118
Exceptional
8.6%

Demographics Similar to Greeks by Unemployment Among Women with Children Ages 6 to 17 years

In terms of unemployment among women with children ages 6 to 17 years, the demographic groups most similar to Greeks are Immigrants from Eastern Africa (8.9%, a difference of 0.040%), Immigrants from Northern Europe (8.9%, a difference of 0.040%), Croatian (8.8%, a difference of 0.050%), Costa Rican (8.8%, a difference of 0.11%), and Immigrants from Europe (8.9%, a difference of 0.11%).
DemographicsRating | RankUnemployment Among Women with Children Ages 6 to 17 years
Immigrants | Kenya
86.1
/100
|
#143
Excellent
8.8%
Russians
85.8
/100
|
#144
Excellent
8.8%
Kenyans
85.6
/100
|
#145
Excellent
8.8%
Chileans
80.8
/100
|
#146
Excellent
8.8%
Immigrants | Bangladesh
79.4
/100
|
#147
Good
8.8%
Costa Ricans
77.0
/100
|
#148
Good
8.8%
Croatians
76.0
/100
|
#149
Good
8.8%
Greeks
75.2
/100
|
#150
Good
8.9%
Immigrants | Eastern Africa
74.6
/100
|
#151
Good
8.9%
Immigrants | Northern Europe
74.6
/100
|
#152
Good
8.9%
Immigrants | Europe
73.4
/100
|
#153
Good
8.9%
Vietnamese
72.1
/100
|
#154
Good
8.9%
Immigrants | Greece
71.8
/100
|
#155
Good
8.9%
Osage
65.9
/100
|
#156
Good
8.9%
Immigrants | Belgium
65.6
/100
|
#157
Good
8.9%