Immigrants from Turkey vs Honduran Unemployment Among Women with Children Under 6 years

COMPARE

Immigrants from Turkey
Race
Ancestry
AfghanAfricanAlaska NativeAlaskan AthabascanAlbanianAleutAlsatianAmericanApacheArabArapahoArgentineanArmenianAssyrian/Chaldean/SyriacAustralianAustrianBahamianBangladeshiBarbadianBasqueBelgianBelizeanBermudanBhutaneseBlackfeetBolivianBrazilianBritishBritish West IndianBulgarianBurmeseCajunCambodianCanadianCape VerdeanCarpatho RusynCelticCentral AmericanCentral American IndianCherokeeCheyenneChickasawChileanChineseChippewaChoctawColombianColvilleComancheCosta RicanCreeCreekCroatianCrowCubanCypriotCzechCzechoslovakianDanishDelawareDominicanDutchDutch West IndianEastern EuropeanEcuadorianEgyptianEnglishEstonianEthiopianEuropeanFijianFilipinoFinnishFrenchFrench American IndianFrench CanadianGermanGerman RussianGhanaianGreekGuamanian/ChamorroGuatemalanGuyaneseHaitianHmongHopiHoumaHungarianIcelanderIndian (Asian)IndonesianInupiatIranianIraqiIrishIroquoisIsraeliItalianJamaicanJapaneseJordanianKenyanKiowaKoreanLaotianLatvianLebaneseLiberianLithuanianLumbeeLuxembourgerMacedonianMalaysianMalteseMarshalleseMenomineeMexicanMexican American IndianMongolianMoroccanNative HawaiianNavajoNepaleseNew ZealanderNicaraguanNigerianNorthern EuropeanNorwegianOkinawanOsageOttawaPaiutePakistaniPalestinianPanamanianParaguayanPennsylvania GermanPeruvianPimaPolishPortuguesePotawatomiPuebloPuerto RicanPuget Sound SalishRomanianRussianSalvadoranSamoanScandinavianScotch-IrishScottishSeminoleSenegaleseSerbianShoshoneSierra LeoneanSiouxSlavicSlovakSloveneSomaliSouth AfricanSouth AmericanSouth American IndianSoviet UnionSpaniardSpanishSpanish AmericanSpanish American IndianSri LankanSubsaharan AfricanSudaneseSwedishSwissSyrianTaiwaneseThaiTlingit-HaidaTohono O'OdhamTonganTrinidadian and TobagonianTsimshianTurkishU.S. Virgin IslanderUgandanUkrainianUruguayanUteVenezuelanVietnameseWelshWest IndianYakamaYaquiYugoslavianYumanYup'ikZimbabwean
Immigration
NonimmigrantsImmigrantsAfghanistanAfricaAlbaniaArgentinaArmeniaAsiaAustraliaAustriaBahamasBangladeshBarbadosBelarusBelgiumBelizeBoliviaBosnia and HerzegovinaBrazilBulgariaBurma/MyanmarCabo VerdeCambodiaCameroonCanadaCaribbeanCentral AmericaChileChinaColombiaCongoCosta RicaCroatiaCubaCzechoslovakiaDenmarkDominicaDominican RepublicEastern AfricaEastern AsiaEastern EuropeEcuadorEgyptEl SalvadorEnglandEritreaEthiopiaEuropeFijiFranceGermanyGhanaGreeceGrenadaGuatemalaGuyanaHaitiHondurasHong KongHungaryIndiaIndonesiaIranIraqIrelandIsraelItalyJamaicaJapanJordanKazakhstanKenyaKoreaKuwaitLaosLatin AmericaLatviaLebanonLiberiaLithuaniaMalaysiaMexicoMicronesiaMiddle AfricaMoldovaMoroccoNepalNetherlandsNicaraguaNigeriaNorth AmericaNorth MacedoniaNorthern AfricaNorthern EuropeNorwayOceaniaPakistanPanamaPeruPhilippinesPolandPortugalRomaniaRussiaSaudi ArabiaScotlandSenegalSerbiaSierra LeoneSingaporeSomaliaSouth AfricaSouth AmericaSouth Central AsiaSouth Eastern AsiaSouthern EuropeSpainSri LankaSt. Vincent and the GrenadinesSudanSwedenSwitzerlandSyriaTaiwanThailandTrinidad and TobagoTurkeyUgandaUkraineUruguayUzbekistanVenezuelaVietnamWest IndiesWestern AfricaWestern AsiaWestern EuropeYemenZaireZimbabweAzores
Honduran
Race
Ancestry
AfghanAfricanAlaska NativeAlaskan AthabascanAlbanianAleutAlsatianAmericanApacheArabArapahoArgentineanArmenianAssyrian/Chaldean/SyriacAustralianAustrianBahamianBangladeshiBarbadianBasqueBelgianBelizeanBermudanBhutaneseBlackfeetBolivianBrazilianBritishBritish West IndianBulgarianBurmeseCajunCambodianCanadianCape VerdeanCarpatho RusynCelticCentral AmericanCentral American IndianCherokeeCheyenneChickasawChileanChineseChippewaChoctawColombianColvilleComancheCosta RicanCreeCreekCroatianCrowCubanCypriotCzechCzechoslovakianDanishDelawareDominicanDutchDutch West IndianEastern EuropeanEcuadorianEgyptianEnglishEstonianEthiopianEuropeanFijianFilipinoFinnishFrenchFrench American IndianFrench CanadianGermanGerman RussianGhanaianGreekGuamanian/ChamorroGuatemalanGuyaneseHaitianHmongHonduranHopiHoumaHungarianIcelanderIndian (Asian)IndonesianInupiatIranianIraqiIrishIroquoisIsraeliItalianJamaicanJapaneseJordanianKenyanKiowaKoreanLaotianLatvianLebaneseLiberianLithuanianLumbeeLuxembourgerMacedonianMalaysianMalteseMarshalleseMenomineeMexicanMexican American IndianMongolianMoroccanNative HawaiianNavajoNepaleseNew ZealanderNicaraguanNigerianNorthern EuropeanNorwegianOkinawanOsageOttawaPaiutePakistaniPalestinianPanamanianParaguayanPennsylvania GermanPeruvianPimaPolishPortuguesePotawatomiPuebloPuerto RicanPuget Sound SalishRomanianRussianSalvadoranSamoanScandinavianScotch-IrishScottishSeminoleSenegaleseSerbianShoshoneSierra LeoneanSiouxSlavicSlovakSloveneSomaliSouth AfricanSouth AmericanSouth American IndianSoviet UnionSpaniardSpanishSpanish AmericanSpanish American IndianSri LankanSubsaharan AfricanSudaneseSwedishSwissSyrianTaiwaneseThaiTlingit-HaidaTohono O'OdhamTonganTrinidadian and TobagonianTsimshianTurkishU.S. Virgin IslanderUgandanUkrainianUruguayanUteVenezuelanVietnameseWelshWest IndianYakamaYaquiYugoslavianYumanYup'ikZimbabwean
Immigration
NonimmigrantsImmigrantsAfghanistanAfricaAlbaniaArgentinaArmeniaAsiaAustraliaAustriaBahamasBangladeshBarbadosBelarusBelgiumBelizeBoliviaBosnia and HerzegovinaBrazilBulgariaBurma/MyanmarCabo VerdeCambodiaCameroonCanadaCaribbeanCentral AmericaChileChinaColombiaCongoCosta RicaCroatiaCubaCzechoslovakiaDenmarkDominicaDominican RepublicEastern AfricaEastern AsiaEastern EuropeEcuadorEgyptEl SalvadorEnglandEritreaEthiopiaEuropeFijiFranceGermanyGhanaGreeceGrenadaGuatemalaGuyanaHaitiHondurasHong KongHungaryIndiaIndonesiaIranIraqIrelandIsraelItalyJamaicaJapanJordanKazakhstanKenyaKoreaKuwaitLaosLatin AmericaLatviaLebanonLiberiaLithuaniaMalaysiaMexicoMicronesiaMiddle AfricaMoldovaMoroccoNepalNetherlandsNicaraguaNigeriaNorth AmericaNorth MacedoniaNorthern AfricaNorthern EuropeNorwayOceaniaPakistanPanamaPeruPhilippinesPolandPortugalRomaniaRussiaSaudi ArabiaScotlandSenegalSerbiaSierra LeoneSingaporeSomaliaSouth AfricaSouth AmericaSouth Central AsiaSouth Eastern AsiaSouthern EuropeSpainSri LankaSt. Vincent and the GrenadinesSudanSwedenSwitzerlandSyriaTaiwanThailandTrinidad and TobagoUgandaUkraineUruguayUzbekistanVenezuelaVietnamWest IndiesWestern AfricaWestern AsiaWestern EuropeYemenZaireZimbabweAzores
Unemployment Among Women with Children Under 6 years
Income
Poverty
Unemployment
Labor Participation
Family Structure
Vehicle Availability
Education Level
Disability

Unemployment Among Women with Children Under 6 years Comparison

Immigrants from Turkey

Hondurans

Exceptional
Tragic
6.9%
UNEMPLOYMENT AMONG WOMEN WITH CHILDREN UNDER 6 YEARS
99.8/ 100
METRIC RATING
58th/ 347
METRIC RANK
8.4%
UNEMPLOYMENT AMONG WOMEN WITH CHILDREN UNDER 6 YEARS
0.3/ 100
METRIC RATING
264th/ 347
METRIC RANK

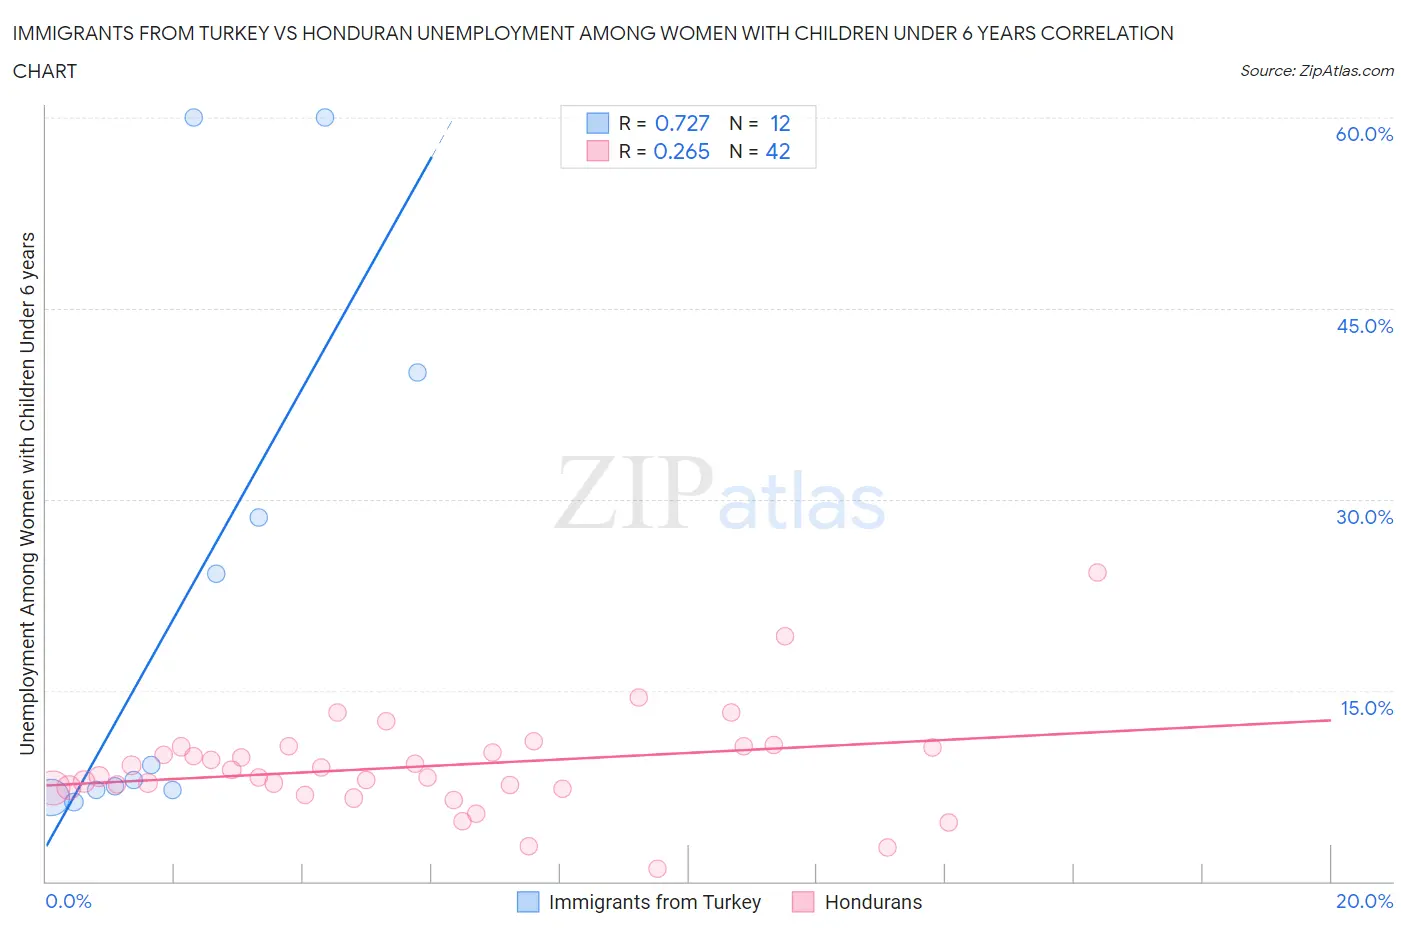
Immigrants from Turkey vs Honduran Unemployment Among Women with Children Under 6 years Correlation Chart

The statistical analysis conducted on geographies consisting of 185,874,428 people shows a strong positive correlation between the proportion of Immigrants from Turkey and unemployment rate among women with children under the age of 6 in the United States with a correlation coefficient (R) of 0.727 and weighted average of 6.9%. Similarly, the statistical analysis conducted on geographies consisting of 285,811,786 people shows a weak positive correlation between the proportion of Hondurans and unemployment rate among women with children under the age of 6 in the United States with a correlation coefficient (R) of 0.265 and weighted average of 8.4%, a difference of 22.2%.
Immigrants from Turkey vs Honduran Unemployment Among Women with Children Under 6 years

Unemployment Among Women with Children Under 6 years Correlation Summary

MeasurementImmigrants from TurkeyHonduran
Minimum6.2%1.0%
Maximum60.0%24.3%
Range53.8%23.3%
Mean22.0%9.0%
Median8.5%8.5%
Interquartile 25% (IQ1)7.1%7.3%
Interquartile 75% (IQ3)34.3%10.6%
Interquartile Range (IQR)27.2%3.2%
Standard Deviation (Sample)20.8%4.0%
Standard Deviation (Population)19.9%4.0%

Similar Demographics by Unemployment Among Women with Children Under 6 years

Demographics Similar to Immigrants from Turkey by Unemployment Among Women with Children Under 6 years

In terms of unemployment among women with children under 6 years, the demographic groups most similar to Immigrants from Turkey are Immigrants from Serbia (6.9%, a difference of 0.070%), Immigrants from Sri Lanka (6.9%, a difference of 0.14%), Immigrants from Ethiopia (6.9%, a difference of 0.23%), Icelander (6.9%, a difference of 0.23%), and Immigrants from Ukraine (6.8%, a difference of 0.34%).
DemographicsRating | RankUnemployment Among Women with Children Under 6 years
Ethiopians
99.9
/100
|
#51
Exceptional
6.8%
Immigrants | Iran
99.9
/100
|
#52
Exceptional
6.8%
Chinese
99.9
/100
|
#53
Exceptional
6.8%
Immigrants | Latvia
99.9
/100
|
#54
Exceptional
6.8%
Immigrants | Ukraine
99.8
/100
|
#55
Exceptional
6.8%
Immigrants | Ethiopia
99.8
/100
|
#56
Exceptional
6.9%
Icelanders
99.8
/100
|
#57
Exceptional
6.9%
Immigrants | Turkey
99.8
/100
|
#58
Exceptional
6.9%
Immigrants | Serbia
99.8
/100
|
#59
Exceptional
6.9%
Immigrants | Sri Lanka
99.8
/100
|
#60
Exceptional
6.9%
Immigrants | France
99.7
/100
|
#61
Exceptional
6.9%
Somalis
99.7
/100
|
#62
Exceptional
6.9%
Maltese
99.7
/100
|
#63
Exceptional
6.9%
Tongans
99.7
/100
|
#64
Exceptional
6.9%
Immigrants | Kuwait
99.7
/100
|
#65
Exceptional
6.9%

Demographics Similar to Hondurans by Unemployment Among Women with Children Under 6 years

In terms of unemployment among women with children under 6 years, the demographic groups most similar to Hondurans are Scotch-Irish (8.4%, a difference of 0.020%), West Indian (8.4%, a difference of 0.050%), French Canadian (8.4%, a difference of 0.050%), Immigrants from Honduras (8.4%, a difference of 0.050%), and Immigrants from Liberia (8.4%, a difference of 0.060%).
DemographicsRating | RankUnemployment Among Women with Children Under 6 years
British West Indians
0.5
/100
|
#257
Tragic
8.3%
Immigrants | Ghana
0.5
/100
|
#258
Tragic
8.3%
Barbadians
0.4
/100
|
#259
Tragic
8.3%
Whites/Caucasians
0.3
/100
|
#260
Tragic
8.4%
Immigrants | Liberia
0.3
/100
|
#261
Tragic
8.4%
West Indians
0.3
/100
|
#262
Tragic
8.4%
Scotch-Irish
0.3
/100
|
#263
Tragic
8.4%
Hondurans
0.3
/100
|
#264
Tragic
8.4%
French Canadians
0.3
/100
|
#265
Tragic
8.4%
Immigrants | Honduras
0.3
/100
|
#266
Tragic
8.4%
Belizeans
0.2
/100
|
#267
Tragic
8.4%
Sub-Saharan Africans
0.2
/100
|
#268
Tragic
8.4%
Immigrants | Haiti
0.2
/100
|
#269
Tragic
8.4%
Immigrants | Senegal
0.2
/100
|
#270
Tragic
8.5%
Immigrants | Congo
0.2
/100
|
#271
Tragic
8.5%