Immigrants from Romania vs Puerto Rican Unemployment Among Ages 25 to 29 years

COMPARE

Immigrants from Romania
Race
Ancestry
AfghanAfricanAlaska NativeAlaskan AthabascanAlbanianAleutAlsatianAmericanApacheArabArapahoArgentineanArmenianAssyrian/Chaldean/SyriacAustralianAustrianBahamianBangladeshiBarbadianBasqueBelgianBelizeanBermudanBhutaneseBlackfeetBolivianBrazilianBritishBritish West IndianBulgarianBurmeseCajunCambodianCanadianCape VerdeanCarpatho RusynCelticCentral AmericanCentral American IndianCherokeeCheyenneChickasawChileanChineseChippewaChoctawColombianColvilleComancheCosta RicanCreeCreekCroatianCrowCubanCypriotCzechCzechoslovakianDanishDelawareDominicanDutchDutch West IndianEastern EuropeanEcuadorianEgyptianEnglishEstonianEthiopianEuropeanFijianFilipinoFinnishFrenchFrench American IndianFrench CanadianGermanGerman RussianGhanaianGreekGuamanian/ChamorroGuatemalanGuyaneseHaitianHmongHonduranHopiHoumaHungarianIcelanderIndian (Asian)IndonesianInupiatIranianIraqiIrishIroquoisIsraeliItalianJamaicanJapaneseJordanianKenyanKiowaKoreanLaotianLatvianLebaneseLiberianLithuanianLumbeeLuxembourgerMacedonianMalaysianMalteseMarshalleseMenomineeMexicanMexican American IndianMongolianMoroccanNative HawaiianNavajoNepaleseNew ZealanderNicaraguanNigerianNorthern EuropeanNorwegianOkinawanOsageOttawaPaiutePakistaniPalestinianPanamanianParaguayanPennsylvania GermanPeruvianPimaPolishPortuguesePotawatomiPuebloPuget Sound SalishRomanianRussianSalvadoranSamoanScandinavianScotch-IrishScottishSeminoleSenegaleseSerbianShoshoneSierra LeoneanSiouxSlavicSlovakSloveneSomaliSouth AfricanSouth AmericanSouth American IndianSoviet UnionSpaniardSpanishSpanish AmericanSpanish American IndianSri LankanSubsaharan AfricanSudaneseSwedishSwissSyrianTaiwaneseThaiTlingit-HaidaTohono O'OdhamTonganTrinidadian and TobagonianTsimshianTurkishU.S. Virgin IslanderUgandanUkrainianUruguayanUteVenezuelanVietnameseWelshWest IndianYakamaYaquiYugoslavianYumanYup'ikZimbabwean
Immigration
NonimmigrantsImmigrantsAfghanistanAfricaAlbaniaArgentinaArmeniaAsiaAustraliaAustriaBahamasBangladeshBarbadosBelarusBelgiumBelizeBoliviaBosnia and HerzegovinaBrazilBulgariaBurma/MyanmarCabo VerdeCambodiaCameroonCanadaCaribbeanCentral AmericaChileChinaColombiaCongoCosta RicaCroatiaCubaCzechoslovakiaDenmarkDominicaDominican RepublicEastern AfricaEastern AsiaEastern EuropeEcuadorEgyptEl SalvadorEnglandEritreaEthiopiaEuropeFijiFranceGermanyGhanaGreeceGrenadaGuatemalaGuyanaHaitiHondurasHong KongHungaryIndiaIndonesiaIranIraqIrelandIsraelItalyJamaicaJapanJordanKazakhstanKenyaKoreaKuwaitLaosLatin AmericaLatviaLebanonLiberiaLithuaniaMalaysiaMexicoMicronesiaMiddle AfricaMoldovaMoroccoNepalNetherlandsNicaraguaNigeriaNorth AmericaNorth MacedoniaNorthern AfricaNorthern EuropeNorwayOceaniaPakistanPanamaPeruPhilippinesPolandPortugalRomaniaRussiaSaudi ArabiaScotlandSenegalSerbiaSierra LeoneSingaporeSomaliaSouth AfricaSouth AmericaSouth Central AsiaSouth Eastern AsiaSouthern EuropeSpainSri LankaSt. Vincent and the GrenadinesSudanSwedenSwitzerlandSyriaTaiwanThailandTrinidad and TobagoTurkeyUgandaUkraineUruguayUzbekistanVenezuelaVietnamWest IndiesWestern AfricaWestern AsiaWestern EuropeYemenZaireZimbabweAzores
Puerto Rican
Race
Ancestry
AfghanAfricanAlaska NativeAlaskan AthabascanAlbanianAleutAlsatianAmericanApacheArabArapahoArgentineanArmenianAssyrian/Chaldean/SyriacAustralianAustrianBahamianBangladeshiBarbadianBasqueBelgianBelizeanBermudanBhutaneseBlackfeetBolivianBrazilianBritishBritish West IndianBulgarianBurmeseCajunCambodianCanadianCape VerdeanCarpatho RusynCelticCentral AmericanCentral American IndianCherokeeCheyenneChickasawChileanChineseChippewaChoctawColombianColvilleComancheCosta RicanCreeCreekCroatianCrowCubanCypriotCzechCzechoslovakianDanishDelawareDominicanDutchDutch West IndianEastern EuropeanEcuadorianEgyptianEnglishEstonianEthiopianEuropeanFijianFilipinoFinnishFrenchFrench American IndianFrench CanadianGermanGerman RussianGhanaianGreekGuamanian/ChamorroGuatemalanGuyaneseHaitianHmongHonduranHopiHoumaHungarianIcelanderIndian (Asian)IndonesianInupiatIranianIraqiIrishIroquoisIsraeliItalianJamaicanJapaneseJordanianKenyanKiowaKoreanLaotianLatvianLebaneseLiberianLithuanianLumbeeLuxembourgerMacedonianMalaysianMalteseMarshalleseMenomineeMexicanMexican American IndianMongolianMoroccanNative HawaiianNavajoNepaleseNew ZealanderNicaraguanNigerianNorthern EuropeanNorwegianOkinawanOsageOttawaPaiutePakistaniPalestinianPanamanianParaguayanPennsylvania GermanPeruvianPimaPolishPortuguesePotawatomiPuebloPuerto RicanPuget Sound SalishRomanianRussianSalvadoranSamoanScandinavianScotch-IrishScottishSeminoleSenegaleseSerbianShoshoneSierra LeoneanSiouxSlavicSlovakSloveneSomaliSouth AfricanSouth AmericanSouth American IndianSoviet UnionSpaniardSpanishSpanish AmericanSpanish American IndianSri LankanSubsaharan AfricanSudaneseSwedishSwissSyrianTaiwaneseThaiTlingit-HaidaTohono O'OdhamTonganTrinidadian and TobagonianTsimshianTurkishU.S. Virgin IslanderUgandanUkrainianUruguayanUteVenezuelanVietnameseWelshWest IndianYakamaYaquiYugoslavianYumanYup'ikZimbabwean
Immigration
NonimmigrantsImmigrantsAfghanistanAfricaAlbaniaArgentinaArmeniaAsiaAustraliaAustriaBahamasBangladeshBarbadosBelarusBelgiumBelizeBoliviaBosnia and HerzegovinaBrazilBulgariaBurma/MyanmarCabo VerdeCambodiaCameroonCanadaCaribbeanCentral AmericaChileChinaColombiaCongoCosta RicaCroatiaCubaCzechoslovakiaDenmarkDominicaDominican RepublicEastern AfricaEastern AsiaEastern EuropeEcuadorEgyptEl SalvadorEnglandEritreaEthiopiaEuropeFijiFranceGermanyGhanaGreeceGrenadaGuatemalaGuyanaHaitiHondurasHong KongHungaryIndiaIndonesiaIranIraqIrelandIsraelItalyJamaicaJapanJordanKazakhstanKenyaKoreaKuwaitLaosLatin AmericaLatviaLebanonLiberiaLithuaniaMalaysiaMexicoMicronesiaMiddle AfricaMoldovaMoroccoNepalNetherlandsNicaraguaNigeriaNorth AmericaNorth MacedoniaNorthern AfricaNorthern EuropeNorwayOceaniaPakistanPanamaPeruPhilippinesPolandPortugalRussiaSaudi ArabiaScotlandSenegalSerbiaSierra LeoneSingaporeSomaliaSouth AfricaSouth AmericaSouth Central AsiaSouth Eastern AsiaSouthern EuropeSpainSri LankaSt. Vincent and the GrenadinesSudanSwedenSwitzerlandSyriaTaiwanThailandTrinidad and TobagoTurkeyUgandaUkraineUruguayUzbekistanVenezuelaVietnamWest IndiesWestern AfricaWestern AsiaWestern EuropeYemenZaireZimbabweAzores
Unemployment Among Ages 25 to 29 years
Income
Poverty
Unemployment
Labor Participation
Family Structure
Vehicle Availability
Education Level
Disability

Unemployment Among Ages 25 to 29 years Comparison

Immigrants from Romania

Puerto Ricans

Exceptional
Tragic
6.3%
UNEMPLOYMENT AMONG AGES 25 TO 29 YEARS
95.9/ 100
METRIC RATING
80th/ 347
METRIC RANK
11.1%
UNEMPLOYMENT AMONG AGES 25 TO 29 YEARS
0.0/ 100
METRIC RATING
335th/ 347
METRIC RANK

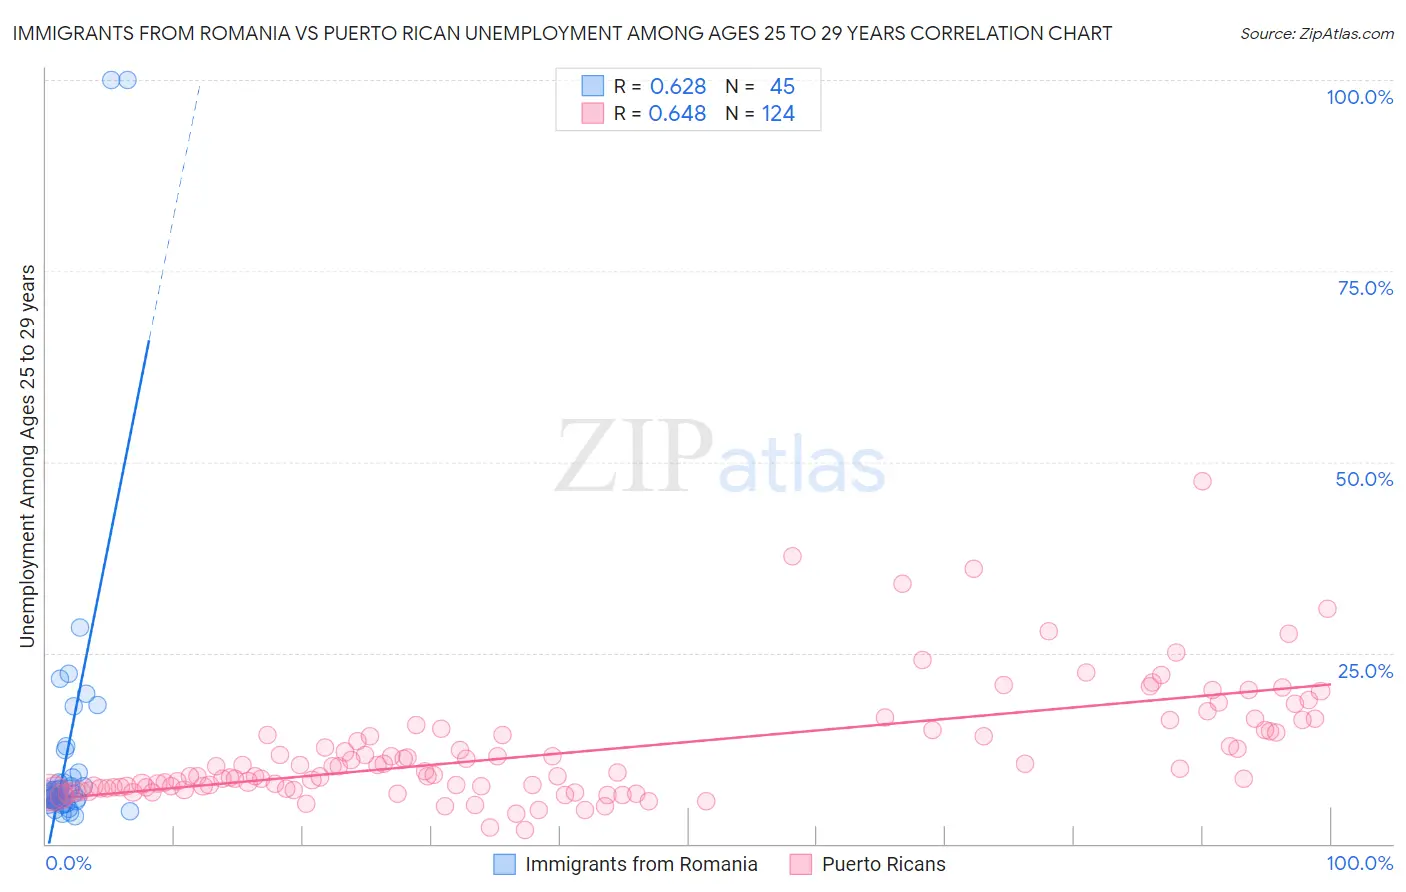
Immigrants from Romania vs Puerto Rican Unemployment Among Ages 25 to 29 years Correlation Chart

The statistical analysis conducted on geographies consisting of 248,720,586 people shows a significant positive correlation between the proportion of Immigrants from Romania and unemployment rate among population between the ages 25 and 29 in the United States with a correlation coefficient (R) of 0.628 and weighted average of 6.3%. Similarly, the statistical analysis conducted on geographies consisting of 485,664,799 people shows a significant positive correlation between the proportion of Puerto Ricans and unemployment rate among population between the ages 25 and 29 in the United States with a correlation coefficient (R) of 0.648 and weighted average of 11.1%, a difference of 75.8%.
Immigrants from Romania vs Puerto Rican Unemployment Among Ages 25 to 29 years

Unemployment Among Ages 25 to 29 years Correlation Summary

MeasurementImmigrants from RomaniaPuerto Rican
Minimum3.6%1.8%
Maximum100.0%47.4%
Range96.4%45.6%
Mean12.6%12.1%
Median6.6%9.4%
Interquartile 25% (IQ1)5.6%7.3%
Interquartile 75% (IQ3)9.0%14.8%
Interquartile Range (IQR)3.4%7.5%
Standard Deviation (Sample)19.8%7.5%
Standard Deviation (Population)19.6%7.5%

Similar Demographics by Unemployment Among Ages 25 to 29 years

Demographics Similar to Immigrants from Romania by Unemployment Among Ages 25 to 29 years

In terms of unemployment among ages 25 to 29 years, the demographic groups most similar to Immigrants from Romania are Iranian (6.3%, a difference of 0.040%), Immigrants from Switzerland (6.3%, a difference of 0.060%), Immigrants from Poland (6.3%, a difference of 0.080%), Slovene (6.3%, a difference of 0.21%), and Asian (6.3%, a difference of 0.24%).
DemographicsRating | RankUnemployment Among Ages 25 to 29 years
Belgians
97.0
/100
|
#73
Exceptional
6.3%
Carpatho Rusyns
96.9
/100
|
#74
Exceptional
6.3%
Immigrants | Jordan
96.8
/100
|
#75
Exceptional
6.3%
Immigrants | Korea
96.7
/100
|
#76
Exceptional
6.3%
Icelanders
96.6
/100
|
#77
Exceptional
6.3%
Asians
96.4
/100
|
#78
Exceptional
6.3%
Immigrants | Switzerland
96.0
/100
|
#79
Exceptional
6.3%
Immigrants | Romania
95.9
/100
|
#80
Exceptional
6.3%
Iranians
95.8
/100
|
#81
Exceptional
6.3%
Immigrants | Poland
95.7
/100
|
#82
Exceptional
6.3%
Slovenes
95.3
/100
|
#83
Exceptional
6.3%
Immigrants | Spain
95.2
/100
|
#84
Exceptional
6.3%
Immigrants | Sweden
95.1
/100
|
#85
Exceptional
6.3%
Immigrants | Asia
94.9
/100
|
#86
Exceptional
6.3%
Marshallese
94.7
/100
|
#87
Exceptional
6.4%

Demographics Similar to Puerto Ricans by Unemployment Among Ages 25 to 29 years

In terms of unemployment among ages 25 to 29 years, the demographic groups most similar to Puerto Ricans are Lumbee (11.2%, a difference of 1.1%), Yuman (11.0%, a difference of 1.1%), Menominee (11.3%, a difference of 1.3%), Alaskan Athabascan (10.8%, a difference of 3.1%), and Sioux (11.7%, a difference of 4.9%).
DemographicsRating | RankUnemployment Among Ages 25 to 29 years
Apache
0.0
/100
|
#328
Tragic
9.5%
Aleuts
0.0
/100
|
#329
Tragic
9.7%
Natives/Alaskans
0.0
/100
|
#330
Tragic
9.8%
Alaska Natives
0.0
/100
|
#331
Tragic
10.2%
Pueblo
0.0
/100
|
#332
Tragic
10.4%
Alaskan Athabascans
0.0
/100
|
#333
Tragic
10.8%
Yuman
0.0
/100
|
#334
Tragic
11.0%
Puerto Ricans
0.0
/100
|
#335
Tragic
11.1%
Lumbee
0.0
/100
|
#336
Tragic
11.2%
Menominee
0.0
/100
|
#337
Tragic
11.3%
Sioux
0.0
/100
|
#338
Tragic
11.7%
Pima
0.0
/100
|
#339
Tragic
11.8%
Cheyenne
0.0
/100
|
#340
Tragic
11.8%
Tohono O'odham
0.0
/100
|
#341
Tragic
12.1%
Navajo
0.0
/100
|
#342
Tragic
12.2%