Immigrants from Romania vs Immigrants from Uzbekistan Unemployment Among Ages 25 to 29 years

COMPARE

Immigrants from Romania
Race
Ancestry
AfghanAfricanAlaska NativeAlaskan AthabascanAlbanianAleutAlsatianAmericanApacheArabArapahoArgentineanArmenianAssyrian/Chaldean/SyriacAustralianAustrianBahamianBangladeshiBarbadianBasqueBelgianBelizeanBermudanBhutaneseBlackfeetBolivianBrazilianBritishBritish West IndianBulgarianBurmeseCajunCambodianCanadianCape VerdeanCarpatho RusynCelticCentral AmericanCentral American IndianCherokeeCheyenneChickasawChileanChineseChippewaChoctawColombianColvilleComancheCosta RicanCreeCreekCroatianCrowCubanCypriotCzechCzechoslovakianDanishDelawareDominicanDutchDutch West IndianEastern EuropeanEcuadorianEgyptianEnglishEstonianEthiopianEuropeanFijianFilipinoFinnishFrenchFrench American IndianFrench CanadianGermanGerman RussianGhanaianGreekGuamanian/ChamorroGuatemalanGuyaneseHaitianHmongHonduranHopiHoumaHungarianIcelanderIndian (Asian)IndonesianInupiatIranianIraqiIrishIroquoisIsraeliItalianJamaicanJapaneseJordanianKenyanKiowaKoreanLaotianLatvianLebaneseLiberianLithuanianLumbeeLuxembourgerMacedonianMalaysianMalteseMarshalleseMenomineeMexicanMexican American IndianMongolianMoroccanNative HawaiianNavajoNepaleseNew ZealanderNicaraguanNigerianNorthern EuropeanNorwegianOkinawanOsageOttawaPaiutePakistaniPalestinianPanamanianParaguayanPennsylvania GermanPeruvianPimaPolishPortuguesePotawatomiPuebloPuerto RicanPuget Sound SalishRomanianRussianSalvadoranSamoanScandinavianScotch-IrishScottishSeminoleSenegaleseSerbianShoshoneSierra LeoneanSiouxSlavicSlovakSloveneSomaliSouth AfricanSouth AmericanSouth American IndianSoviet UnionSpaniardSpanishSpanish AmericanSpanish American IndianSri LankanSubsaharan AfricanSudaneseSwedishSwissSyrianTaiwaneseThaiTlingit-HaidaTohono O'OdhamTonganTrinidadian and TobagonianTsimshianTurkishU.S. Virgin IslanderUgandanUkrainianUruguayanUteVenezuelanVietnameseWelshWest IndianYakamaYaquiYugoslavianYumanYup'ikZimbabwean
Immigration
NonimmigrantsImmigrantsAfghanistanAfricaAlbaniaArgentinaArmeniaAsiaAustraliaAustriaBahamasBangladeshBarbadosBelarusBelgiumBelizeBoliviaBosnia and HerzegovinaBrazilBulgariaBurma/MyanmarCabo VerdeCambodiaCameroonCanadaCaribbeanCentral AmericaChileChinaColombiaCongoCosta RicaCroatiaCubaCzechoslovakiaDenmarkDominicaDominican RepublicEastern AfricaEastern AsiaEastern EuropeEcuadorEgyptEl SalvadorEnglandEritreaEthiopiaEuropeFijiFranceGermanyGhanaGreeceGrenadaGuatemalaGuyanaHaitiHondurasHong KongHungaryIndiaIndonesiaIranIraqIrelandIsraelItalyJamaicaJapanJordanKazakhstanKenyaKoreaKuwaitLaosLatin AmericaLatviaLebanonLiberiaLithuaniaMalaysiaMexicoMicronesiaMiddle AfricaMoldovaMoroccoNepalNetherlandsNicaraguaNigeriaNorth AmericaNorth MacedoniaNorthern AfricaNorthern EuropeNorwayOceaniaPakistanPanamaPeruPhilippinesPolandPortugalRomaniaRussiaSaudi ArabiaScotlandSenegalSerbiaSierra LeoneSingaporeSomaliaSouth AfricaSouth AmericaSouth Central AsiaSouth Eastern AsiaSouthern EuropeSpainSri LankaSt. Vincent and the GrenadinesSudanSwedenSwitzerlandSyriaTaiwanThailandTrinidad and TobagoTurkeyUgandaUkraineUruguayVenezuelaVietnamWest IndiesWestern AfricaWestern AsiaWestern EuropeYemenZaireZimbabweAzores
Immigrants from Uzbekistan
Race
Ancestry
AfghanAfricanAlaska NativeAlaskan AthabascanAlbanianAleutAlsatianAmericanApacheArabArapahoArgentineanArmenianAssyrian/Chaldean/SyriacAustralianAustrianBahamianBangladeshiBarbadianBasqueBelgianBelizeanBermudanBhutaneseBlackfeetBolivianBrazilianBritishBritish West IndianBulgarianBurmeseCajunCambodianCanadianCape VerdeanCarpatho RusynCelticCentral AmericanCentral American IndianCherokeeCheyenneChickasawChileanChineseChippewaChoctawColombianColvilleComancheCosta RicanCreeCreekCroatianCrowCubanCypriotCzechCzechoslovakianDanishDelawareDominicanDutchDutch West IndianEastern EuropeanEcuadorianEgyptianEnglishEstonianEthiopianEuropeanFijianFilipinoFinnishFrenchFrench American IndianFrench CanadianGermanGerman RussianGhanaianGreekGuamanian/ChamorroGuatemalanGuyaneseHaitianHmongHonduranHopiHoumaHungarianIcelanderIndian (Asian)IndonesianInupiatIranianIraqiIrishIroquoisIsraeliItalianJamaicanJapaneseJordanianKenyanKiowaKoreanLaotianLatvianLebaneseLiberianLithuanianLumbeeLuxembourgerMacedonianMalaysianMalteseMarshalleseMenomineeMexicanMexican American IndianMongolianMoroccanNative HawaiianNavajoNepaleseNew ZealanderNicaraguanNigerianNorthern EuropeanNorwegianOkinawanOsageOttawaPaiutePakistaniPalestinianPanamanianParaguayanPennsylvania GermanPeruvianPimaPolishPortuguesePotawatomiPuebloPuerto RicanPuget Sound SalishRomanianRussianSalvadoranSamoanScandinavianScotch-IrishScottishSeminoleSenegaleseSerbianShoshoneSierra LeoneanSiouxSlavicSlovakSloveneSomaliSouth AfricanSouth AmericanSouth American IndianSoviet UnionSpaniardSpanishSpanish AmericanSpanish American IndianSri LankanSubsaharan AfricanSudaneseSwedishSwissSyrianTaiwaneseThaiTlingit-HaidaTohono O'OdhamTonganTrinidadian and TobagonianTsimshianTurkishU.S. Virgin IslanderUgandanUkrainianUruguayanUteVenezuelanVietnameseWelshWest IndianYakamaYaquiYugoslavianYumanYup'ikZimbabwean
Immigration
NonimmigrantsImmigrantsAfghanistanAfricaAlbaniaArgentinaArmeniaAsiaAustraliaAustriaBahamasBangladeshBarbadosBelarusBelgiumBelizeBoliviaBosnia and HerzegovinaBrazilBulgariaBurma/MyanmarCabo VerdeCambodiaCameroonCanadaCaribbeanCentral AmericaChileChinaColombiaCongoCosta RicaCroatiaCubaCzechoslovakiaDenmarkDominicaDominican RepublicEastern AfricaEastern AsiaEastern EuropeEcuadorEgyptEl SalvadorEnglandEritreaEthiopiaEuropeFijiFranceGermanyGhanaGreeceGrenadaGuatemalaGuyanaHaitiHondurasHong KongHungaryIndiaIndonesiaIranIraqIrelandIsraelItalyJamaicaJapanJordanKazakhstanKenyaKoreaKuwaitLaosLatin AmericaLatviaLebanonLiberiaLithuaniaMalaysiaMexicoMicronesiaMiddle AfricaMoldovaMoroccoNepalNetherlandsNicaraguaNigeriaNorth AmericaNorth MacedoniaNorthern AfricaNorthern EuropeNorwayOceaniaPakistanPanamaPeruPhilippinesPolandPortugalRussiaSaudi ArabiaScotlandSenegalSerbiaSierra LeoneSingaporeSomaliaSouth AfricaSouth AmericaSouth Central AsiaSouth Eastern AsiaSouthern EuropeSpainSri LankaSt. Vincent and the GrenadinesSudanSwedenSwitzerlandSyriaTaiwanThailandTrinidad and TobagoTurkeyUgandaUkraineUruguayUzbekistanVenezuelaVietnamWest IndiesWestern AfricaWestern AsiaWestern EuropeYemenZaireZimbabweAzores
Unemployment Among Ages 25 to 29 years
Income
Poverty
Unemployment
Labor Participation
Family Structure
Vehicle Availability
Education Level
Disability

Unemployment Among Ages 25 to 29 years Comparison

Immigrants from Romania

Immigrants from Uzbekistan

Exceptional
Tragic
6.3%
UNEMPLOYMENT AMONG AGES 25 TO 29 YEARS
95.9/ 100
METRIC RATING
80th/ 347
METRIC RANK
7.2%
UNEMPLOYMENT AMONG AGES 25 TO 29 YEARS
0.7/ 100
METRIC RATING
246th/ 347
METRIC RANK

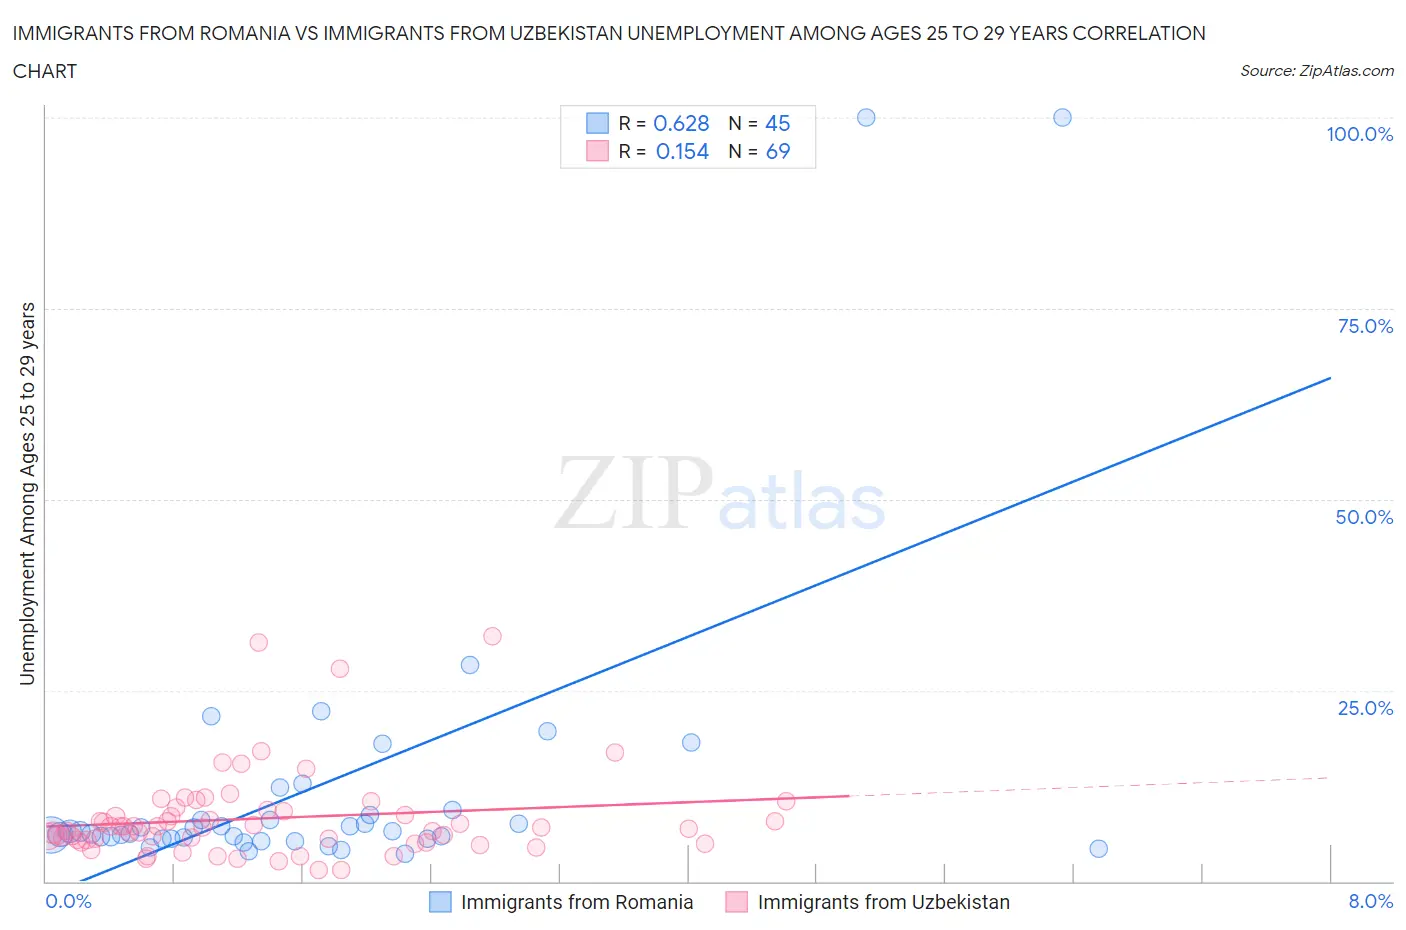
Immigrants from Romania vs Immigrants from Uzbekistan Unemployment Among Ages 25 to 29 years Correlation Chart

The statistical analysis conducted on geographies consisting of 248,720,586 people shows a significant positive correlation between the proportion of Immigrants from Romania and unemployment rate among population between the ages 25 and 29 in the United States with a correlation coefficient (R) of 0.628 and weighted average of 6.3%. Similarly, the statistical analysis conducted on geographies consisting of 116,752,358 people shows a poor positive correlation between the proportion of Immigrants from Uzbekistan and unemployment rate among population between the ages 25 and 29 in the United States with a correlation coefficient (R) of 0.154 and weighted average of 7.2%, a difference of 13.2%.
Immigrants from Romania vs Immigrants from Uzbekistan Unemployment Among Ages 25 to 29 years

Unemployment Among Ages 25 to 29 years Correlation Summary

MeasurementImmigrants from RomaniaImmigrants from Uzbekistan
Minimum3.6%1.4%
Maximum100.0%32.0%
Range96.4%30.6%
Mean12.6%8.2%
Median6.6%7.0%
Interquartile 25% (IQ1)5.6%5.2%
Interquartile 75% (IQ3)9.0%9.2%
Interquartile Range (IQR)3.4%4.0%
Standard Deviation (Sample)19.8%5.8%
Standard Deviation (Population)19.6%5.8%

Similar Demographics by Unemployment Among Ages 25 to 29 years

Demographics Similar to Immigrants from Romania by Unemployment Among Ages 25 to 29 years

In terms of unemployment among ages 25 to 29 years, the demographic groups most similar to Immigrants from Romania are Iranian (6.3%, a difference of 0.040%), Immigrants from Switzerland (6.3%, a difference of 0.060%), Immigrants from Poland (6.3%, a difference of 0.080%), Slovene (6.3%, a difference of 0.21%), and Asian (6.3%, a difference of 0.24%).
DemographicsRating | RankUnemployment Among Ages 25 to 29 years
Belgians
97.0
/100
|
#73
Exceptional
6.3%
Carpatho Rusyns
96.9
/100
|
#74
Exceptional
6.3%
Immigrants | Jordan
96.8
/100
|
#75
Exceptional
6.3%
Immigrants | Korea
96.7
/100
|
#76
Exceptional
6.3%
Icelanders
96.6
/100
|
#77
Exceptional
6.3%
Asians
96.4
/100
|
#78
Exceptional
6.3%
Immigrants | Switzerland
96.0
/100
|
#79
Exceptional
6.3%
Immigrants | Romania
95.9
/100
|
#80
Exceptional
6.3%
Iranians
95.8
/100
|
#81
Exceptional
6.3%
Immigrants | Poland
95.7
/100
|
#82
Exceptional
6.3%
Slovenes
95.3
/100
|
#83
Exceptional
6.3%
Immigrants | Spain
95.2
/100
|
#84
Exceptional
6.3%
Immigrants | Sweden
95.1
/100
|
#85
Exceptional
6.3%
Immigrants | Asia
94.9
/100
|
#86
Exceptional
6.3%
Marshallese
94.7
/100
|
#87
Exceptional
6.4%

Demographics Similar to Immigrants from Uzbekistan by Unemployment Among Ages 25 to 29 years

In terms of unemployment among ages 25 to 29 years, the demographic groups most similar to Immigrants from Uzbekistan are Immigrants from Guatemala (7.2%, a difference of 0.010%), Subsaharan African (7.2%, a difference of 0.18%), Seminole (7.2%, a difference of 0.20%), Delaware (7.2%, a difference of 0.37%), and Guatemalan (7.1%, a difference of 0.40%).
DemographicsRating | RankUnemployment Among Ages 25 to 29 years
Potawatomi
1.3
/100
|
#239
Tragic
7.1%
Native Hawaiians
1.3
/100
|
#240
Tragic
7.1%
Immigrants | Sierra Leone
1.3
/100
|
#241
Tragic
7.1%
Spanish American Indians
1.1
/100
|
#242
Tragic
7.1%
Yaqui
1.0
/100
|
#243
Tragic
7.1%
Immigrants | Nonimmigrants
0.9
/100
|
#244
Tragic
7.1%
Guatemalans
0.9
/100
|
#245
Tragic
7.1%
Immigrants | Uzbekistan
0.7
/100
|
#246
Tragic
7.2%
Immigrants | Guatemala
0.7
/100
|
#247
Tragic
7.2%
Sub-Saharan Africans
0.6
/100
|
#248
Tragic
7.2%
Seminole
0.6
/100
|
#249
Tragic
7.2%
Delaware
0.5
/100
|
#250
Tragic
7.2%
Portuguese
0.5
/100
|
#251
Tragic
7.2%
Sierra Leoneans
0.4
/100
|
#252
Tragic
7.2%
Immigrants | Portugal
0.3
/100
|
#253
Tragic
7.2%