Immigrants from Romania vs Puerto Rican Disability Age 35 to 64
COMPARE
Immigrants from Romania
Puerto Rican
Disability Age 35 to 64
Disability Age 35 to 64 Comparison
Immigrants from Romania
Puerto Ricans
10.0%
DISABILITY AGE 35 TO 64
99.7/ 100
METRIC RATING
64th/ 347
METRIC RANK
15.9%
DISABILITY AGE 35 TO 64
0.0/ 100
METRIC RATING
337th/ 347
METRIC RANK
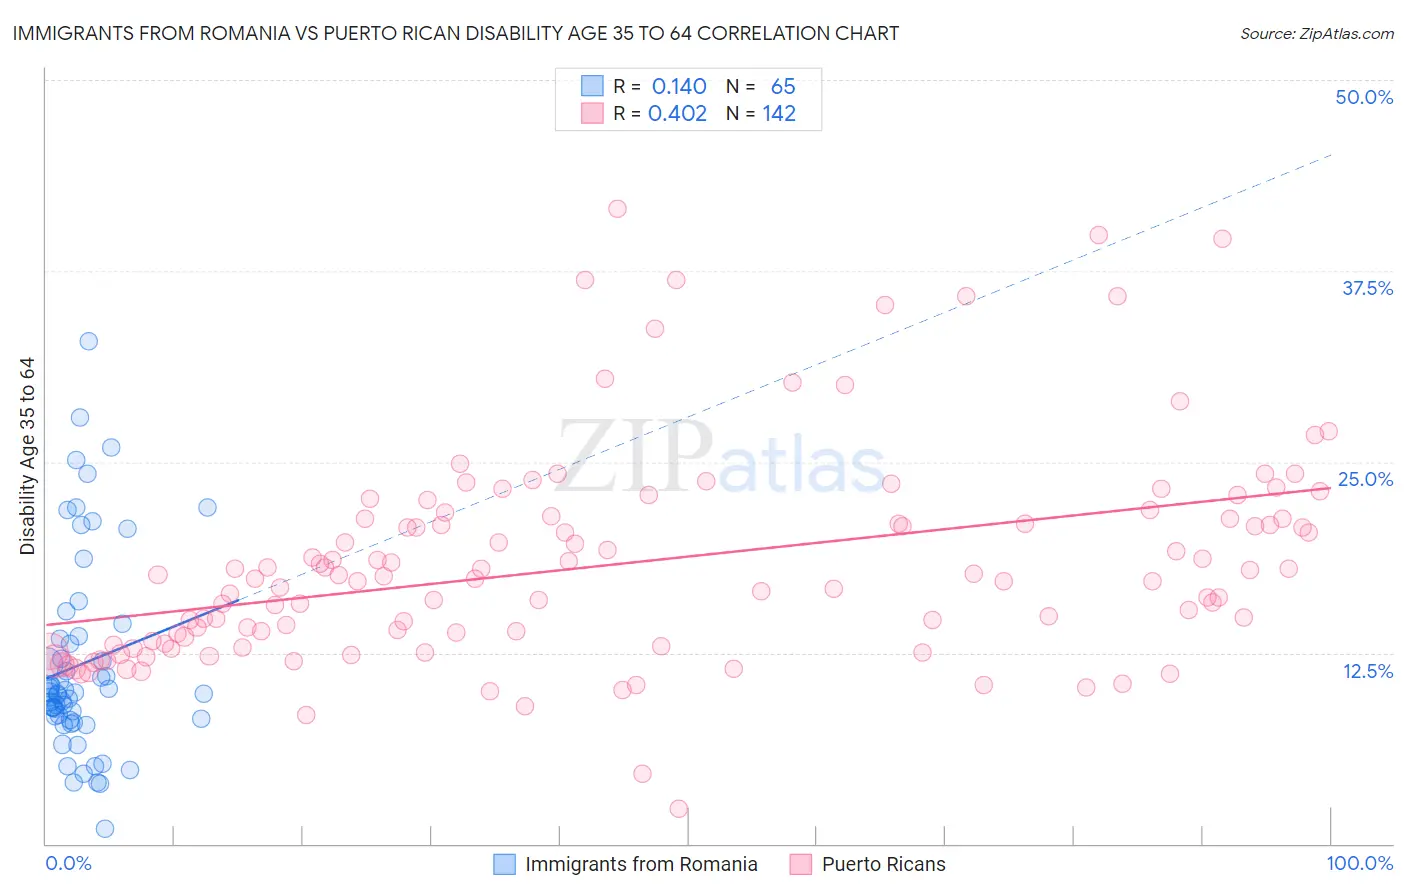
Immigrants from Romania vs Puerto Rican Disability Age 35 to 64 Correlation Chart
The statistical analysis conducted on geographies consisting of 256,941,595 people shows a poor positive correlation between the proportion of Immigrants from Romania and percentage of population with a disability between the ages 34 and 64 in the United States with a correlation coefficient (R) of 0.140 and weighted average of 10.0%. Similarly, the statistical analysis conducted on geographies consisting of 527,542,220 people shows a moderate positive correlation between the proportion of Puerto Ricans and percentage of population with a disability between the ages 34 and 64 in the United States with a correlation coefficient (R) of 0.402 and weighted average of 15.9%, a difference of 59.6%.
Disability Age 35 to 64 Correlation Summary
| Measurement | Immigrants from Romania | Puerto Rican |
| Minimum | 1.0% | 2.3% |
| Maximum | 32.9% | 41.5% |
| Range | 31.8% | 39.2% |
| Mean | 11.8% | 18.3% |
| Median | 9.8% | 17.3% |
| Interquartile 25% (IQ1) | 8.1% | 13.0% |
| Interquartile 75% (IQ3) | 13.5% | 21.2% |
| Interquartile Range (IQR) | 5.3% | 8.2% |
| Standard Deviation (Sample) | 6.5% | 7.0% |
| Standard Deviation (Population) | 6.4% | 7.0% |
Similar Demographics by Disability Age 35 to 64
Demographics Similar to Immigrants from Romania by Disability Age 35 to 64
In terms of disability age 35 to 64, the demographic groups most similar to Immigrants from Romania are Immigrants from Poland (10.0%, a difference of 0.070%), Immigrants from Czechoslovakia (10.0%, a difference of 0.20%), Eastern European (10.0%, a difference of 0.31%), Cuban (10.0%, a difference of 0.32%), and Immigrants from Spain (10.0%, a difference of 0.41%).
| Demographics | Rating | Rank | Disability Age 35 to 64 |
| Colombians | 99.8 /100 | #57 | Exceptional 9.9% |
| Armenians | 99.8 /100 | #58 | Exceptional 9.9% |
| Immigrants | Sweden | 99.7 /100 | #59 | Exceptional 9.9% |
| Immigrants | South America | 99.7 /100 | #60 | Exceptional 9.9% |
| Immigrants | Spain | 99.7 /100 | #61 | Exceptional 10.0% |
| Eastern Europeans | 99.7 /100 | #62 | Exceptional 10.0% |
| Immigrants | Czechoslovakia | 99.7 /100 | #63 | Exceptional 10.0% |
| Immigrants | Romania | 99.7 /100 | #64 | Exceptional 10.0% |
| Immigrants | Poland | 99.6 /100 | #65 | Exceptional 10.0% |
| Cubans | 99.6 /100 | #66 | Exceptional 10.0% |
| Immigrants | Uzbekistan | 99.5 /100 | #67 | Exceptional 10.1% |
| Immigrants | Switzerland | 99.5 /100 | #68 | Exceptional 10.1% |
| Immigrants | Eastern Europe | 99.5 /100 | #69 | Exceptional 10.1% |
| Immigrants | Nicaragua | 99.5 /100 | #70 | Exceptional 10.1% |
| Immigrants | Kazakhstan | 99.5 /100 | #71 | Exceptional 10.1% |
Demographics Similar to Puerto Ricans by Disability Age 35 to 64
In terms of disability age 35 to 64, the demographic groups most similar to Puerto Ricans are Menominee (15.9%, a difference of 0.32%), Seminole (15.9%, a difference of 0.55%), Colville (15.8%, a difference of 0.66%), Yuman (15.8%, a difference of 0.85%), and Chickasaw (16.1%, a difference of 1.0%).
| Demographics | Rating | Rank | Disability Age 35 to 64 |
| Navajo | 0.0 /100 | #330 | Tragic 15.5% |
| Dutch West Indians | 0.0 /100 | #331 | Tragic 15.6% |
| Alaskan Athabascans | 0.0 /100 | #332 | Tragic 15.7% |
| Yuman | 0.0 /100 | #333 | Tragic 15.8% |
| Colville | 0.0 /100 | #334 | Tragic 15.8% |
| Seminole | 0.0 /100 | #335 | Tragic 15.9% |
| Menominee | 0.0 /100 | #336 | Tragic 15.9% |
| Puerto Ricans | 0.0 /100 | #337 | Tragic 15.9% |
| Chickasaw | 0.0 /100 | #338 | Tragic 16.1% |
| Pima | 0.0 /100 | #339 | Tragic 16.1% |
| Choctaw | 0.0 /100 | #340 | Tragic 16.4% |
| Tsimshian | 0.0 /100 | #341 | Tragic 16.7% |
| Tohono O'odham | 0.0 /100 | #342 | Tragic 16.7% |
| Creek | 0.0 /100 | #343 | Tragic 16.9% |
| Yup'ik | 0.0 /100 | #344 | Tragic 16.9% |