Immigrants from Europe vs Immigrants from Norway Unemployment Among Women with Children Ages 6 to 17 years
COMPARE
Immigrants from Europe
Immigrants from Norway
Unemployment Among Women with Children Ages 6 to 17 years
Unemployment Among Women with Children Ages 6 to 17 years Comparison
Immigrants from Europe
Immigrants from Norway
8.9%
UNEMPLOYMENT AMONG WOMEN WITH CHILDREN AGES 6 TO 17 YEARS
73.4/ 100
METRIC RATING
153rd/ 347
METRIC RANK
8.6%
UNEMPLOYMENT AMONG WOMEN WITH CHILDREN AGES 6 TO 17 YEARS
97.8/ 100
METRIC RATING
105th/ 347
METRIC RANK
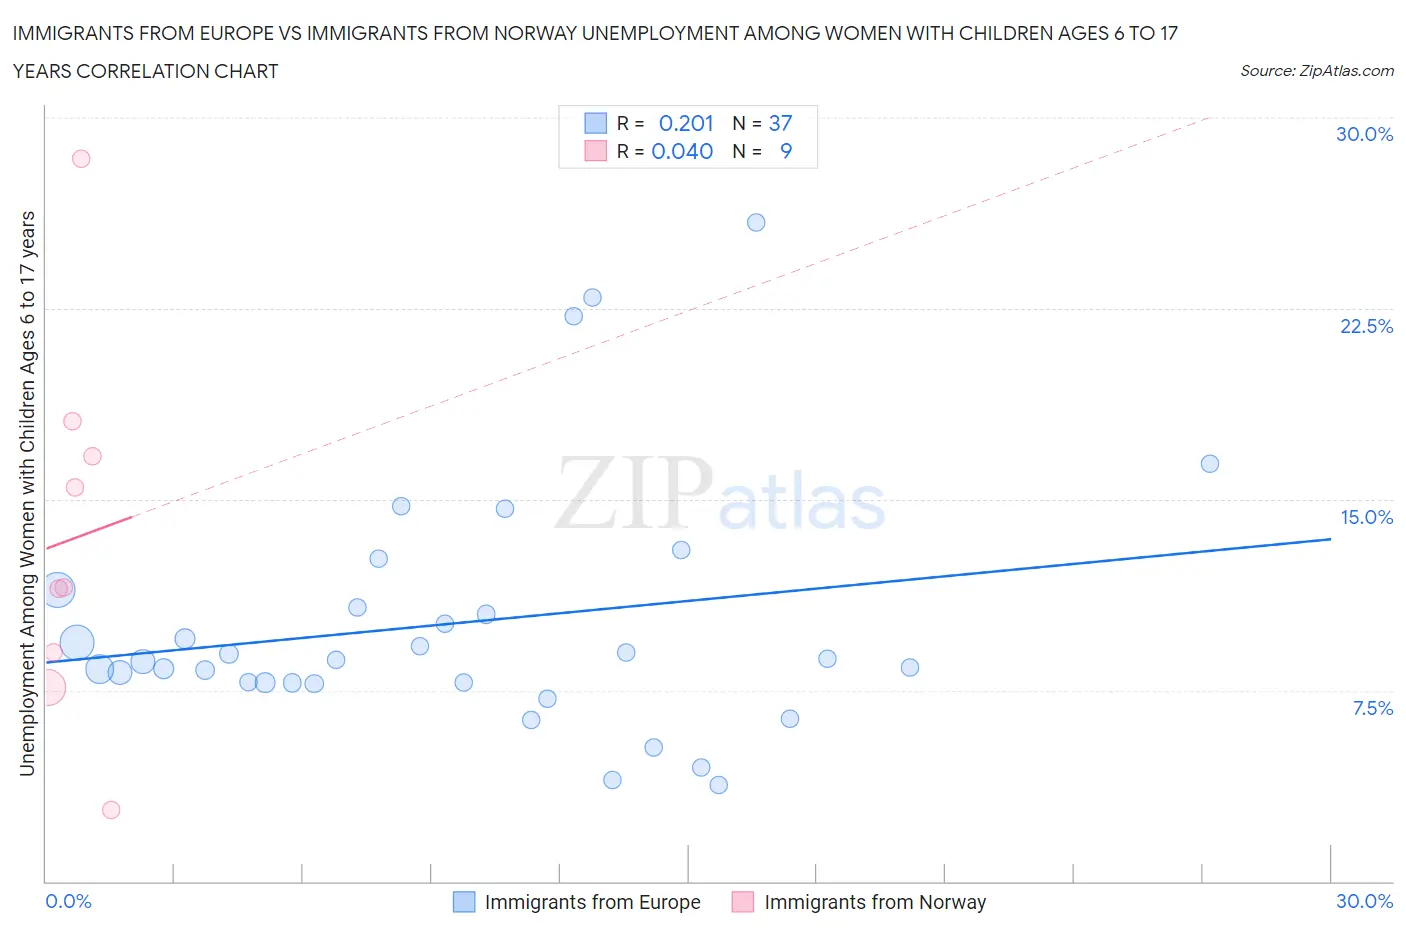
Immigrants from Europe vs Immigrants from Norway Unemployment Among Women with Children Ages 6 to 17 years Correlation Chart
The statistical analysis conducted on geographies consisting of 352,744,841 people shows a weak positive correlation between the proportion of Immigrants from Europe and unemployment rate among women with children between the ages 6 and 17 in the United States with a correlation coefficient (R) of 0.201 and weighted average of 8.9%. Similarly, the statistical analysis conducted on geographies consisting of 97,676,556 people shows no correlation between the proportion of Immigrants from Norway and unemployment rate among women with children between the ages 6 and 17 in the United States with a correlation coefficient (R) of 0.040 and weighted average of 8.6%, a difference of 3.2%.
Unemployment Among Women with Children Ages 6 to 17 years Correlation Summary
| Measurement | Immigrants from Europe | Immigrants from Norway |
| Minimum | 3.8% | 2.8% |
| Maximum | 25.9% | 28.4% |
| Range | 22.1% | 25.6% |
| Mean | 10.1% | 13.5% |
| Median | 8.7% | 11.5% |
| Interquartile 25% (IQ1) | 7.8% | 8.3% |
| Interquartile 75% (IQ3) | 11.1% | 17.4% |
| Interquartile Range (IQR) | 3.3% | 9.1% |
| Standard Deviation (Sample) | 4.9% | 7.4% |
| Standard Deviation (Population) | 4.9% | 6.9% |
Similar Demographics by Unemployment Among Women with Children Ages 6 to 17 years
Demographics Similar to Immigrants from Europe by Unemployment Among Women with Children Ages 6 to 17 years
In terms of unemployment among women with children ages 6 to 17 years, the demographic groups most similar to Immigrants from Europe are Immigrants from Eastern Africa (8.9%, a difference of 0.070%), Immigrants from Northern Europe (8.9%, a difference of 0.070%), Vietnamese (8.9%, a difference of 0.070%), Immigrants from Greece (8.9%, a difference of 0.090%), and Greek (8.9%, a difference of 0.11%).
| Demographics | Rating | Rank | Unemployment Among Women with Children Ages 6 to 17 years |
| Chileans | 80.8 /100 | #146 | Excellent 8.8% |
| Immigrants | Bangladesh | 79.4 /100 | #147 | Good 8.8% |
| Costa Ricans | 77.0 /100 | #148 | Good 8.8% |
| Croatians | 76.0 /100 | #149 | Good 8.8% |
| Greeks | 75.2 /100 | #150 | Good 8.9% |
| Immigrants | Eastern Africa | 74.6 /100 | #151 | Good 8.9% |
| Immigrants | Northern Europe | 74.6 /100 | #152 | Good 8.9% |
| Immigrants | Europe | 73.4 /100 | #153 | Good 8.9% |
| Vietnamese | 72.1 /100 | #154 | Good 8.9% |
| Immigrants | Greece | 71.8 /100 | #155 | Good 8.9% |
| Osage | 65.9 /100 | #156 | Good 8.9% |
| Immigrants | Belgium | 65.6 /100 | #157 | Good 8.9% |
| Immigrants | Chile | 65.3 /100 | #158 | Good 8.9% |
| Spanish | 63.8 /100 | #159 | Good 8.9% |
| Immigrants | Hungary | 63.4 /100 | #160 | Good 8.9% |
Demographics Similar to Immigrants from Norway by Unemployment Among Women with Children Ages 6 to 17 years
In terms of unemployment among women with children ages 6 to 17 years, the demographic groups most similar to Immigrants from Norway are Immigrants from Serbia (8.6%, a difference of 0.040%), Chickasaw (8.6%, a difference of 0.070%), Swedish (8.6%, a difference of 0.080%), Immigrants from France (8.6%, a difference of 0.15%), and Immigrants from Romania (8.6%, a difference of 0.15%).
| Demographics | Rating | Rank | Unemployment Among Women with Children Ages 6 to 17 years |
| Malaysians | 98.5 /100 | #98 | Exceptional 8.6% |
| Immigrants | Lithuania | 98.4 /100 | #99 | Exceptional 8.6% |
| New Zealanders | 98.4 /100 | #100 | Exceptional 8.6% |
| Immigrants | Pakistan | 98.4 /100 | #101 | Exceptional 8.6% |
| Immigrants | South Africa | 98.3 /100 | #102 | Exceptional 8.6% |
| Scandinavians | 98.3 /100 | #103 | Exceptional 8.6% |
| Immigrants | France | 98.0 /100 | #104 | Exceptional 8.6% |
| Immigrants | Norway | 97.8 /100 | #105 | Exceptional 8.6% |
| Immigrants | Serbia | 97.7 /100 | #106 | Exceptional 8.6% |
| Chickasaw | 97.6 /100 | #107 | Exceptional 8.6% |
| Swedes | 97.6 /100 | #108 | Exceptional 8.6% |
| Immigrants | Romania | 97.5 /100 | #109 | Exceptional 8.6% |
| Latvians | 97.4 /100 | #110 | Exceptional 8.6% |
| Immigrants | Ukraine | 97.4 /100 | #111 | Exceptional 8.6% |
| Romanians | 97.1 /100 | #112 | Exceptional 8.6% |