Zip Codes with the Highest Percentage of Population Employed in Management in Murfreesboro, TN

RELATED REPORTS & OPTIONS

Management
Population
Families and Households
Female Fertility
Female Fertility (Unmarried)
Race (Community Size)
Race (Percentage)
Ancestry (Community Size)
AfricanAmericanApacheArabArgentineanArmenianAustralianAustrianBahamianBhutaneseBlackfeetBrazilianBritishBulgarianBurmeseCanadianCelticCentral AmericanCentral American IndianCherokeeChoctawColombianCosta RicanCubanCzechCzechoslovakianDanishDominicanDutchEastern EuropeanEcuadorianEgyptianEnglishEthiopianEuropeanFilipinoFinnishFrenchFrench CanadianGermanGreekGuatemalanHaitianHonduranHungarianIndian (Asian)IndonesianIranianIraqiIrishItalianJamaicanJordanianKoreanLaotianLatvianLebaneseLithuanianMalaysianMexicanMexican American IndianNative HawaiianNigerianNorthern EuropeanNorwegianPakistaniPalestinianPanamanianPeruvianPolishPortuguesePuerto RicanRomanianRussianSalvadoranScandinavianScotch-IrishScottishSlovakSouth AmericanSpaniardSpanishSri LankanSubsaharan AfricanSwedishSwissThaiTrinidadian and TobagonianTurkishUkrainianVenezuelanWelshYugoslavian
Ancestry (Percentage)
AfricanAmericanApacheArabArgentineanArmenianAustralianAustrianBahamianBhutaneseBlackfeetBrazilianBritishBulgarianBurmeseCanadianCelticCentral AmericanCentral American IndianCherokeeChoctawColombianCosta RicanCubanCzechCzechoslovakianDanishDominicanDutchEastern EuropeanEcuadorianEgyptianEnglishEthiopianEuropeanFilipinoFinnishFrenchFrench CanadianGermanGreekGuatemalanHaitianHonduranHungarianIndian (Asian)IndonesianIranianIraqiIrishItalianJamaicanJordanianKoreanLaotianLatvianLebaneseLithuanianMalaysianMexicanMexican American IndianNative HawaiianNigerianNorthern EuropeanNorwegianPakistaniPalestinianPanamanianPeruvianPolishPortuguesePuerto RicanRomanianRussianSalvadoranScandinavianScotch-IrishScottishSlovakSouth AmericanSpaniardSpanishSri LankanSubsaharan AfricanSwedishSwissThaiTrinidadian and TobagonianTurkishUkrainianVenezuelanWelshYugoslavian
Immigrant Origin (Total)
Immigrant Origin (Percentage)
Income
Income (Families)
Income (Households)
Poverty
Poverty (Families)
Unemployment
Employment Occupations
Employment Industries
Employer Class
Commute Time
Commute Means
School Enrollment
Education by Degree Field
Occupancy
Finances
Physical Characteristics
Murfreesboro
Compare Zip Codes
Comparison Subject

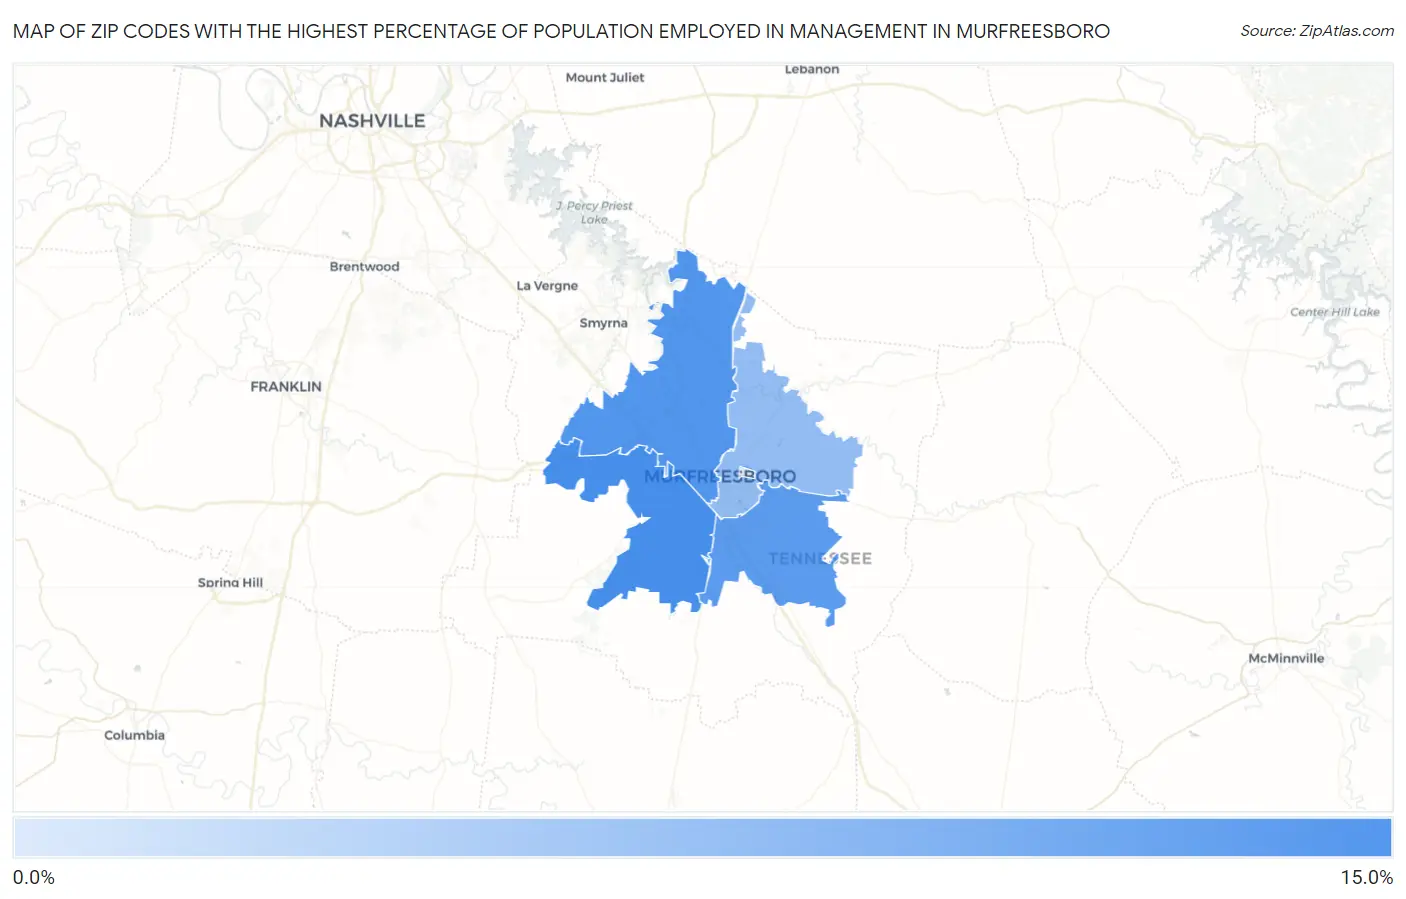
Map of Zip Codes with the Highest Percentage of Population Employed in Management in Murfreesboro

0.0%
15.0%
Zip Codes with the Highest Percentage of Population Employed in Management in Murfreesboro Map

Zip Codes with the Highest Percentage of Population Employed in Management in Murfreesboro, TN

Zip Code % Employed vs State vs National
1.3712813.1%10.4%(+2.72)#11111.0%(+2.06)#9,808
2.3712912.3%10.4%(+1.92)#13111.0%(+1.26)#11,236
3.3712711.7%10.4%(+1.33)#14711.0%(+0.677)#12,381
4.371307.5%10.4%(-2.89)#38511.0%(-3.55)#22,479
5.371322.2%10.4%(-8.14)#57511.0%(-8.79)#29,653

Common Questions

What are the Top 3 Zip Codes with the Highest Percentage of Population Employed in Management in Murfreesboro, TN?
Top 3 Zip Codes with the Highest Percentage of Population Employed in Management in Murfreesboro, TN are:
#1
13.1%
#2
12.3%
#3
11.7%
What zip code has the Highest Percentage of Population Employed in Management in Murfreesboro, TN?
37128 has the Highest Percentage of Population Employed in Management in Murfreesboro, TN with 13.1%.
What is the Percentage of Population Employed in Management in Murfreesboro, TN?
Percentage of Population Employed in Management in Murfreesboro is 10.7%.
What is the Percentage of Population Employed in Management in Tennessee?
Percentage of Population Employed in Management in Tennessee is 10.4%.
What is the Percentage of Population Employed in Management in the United States?
Percentage of Population Employed in Management in the United States is 11.0%.