Zip Codes with the Highest Percentage of Population with a Degree in Liberal Arts and History in Cookeville, TN
RELATED REPORTS & OPTIONS
Liberal Arts and History
Cookeville
Compare Zip Codes
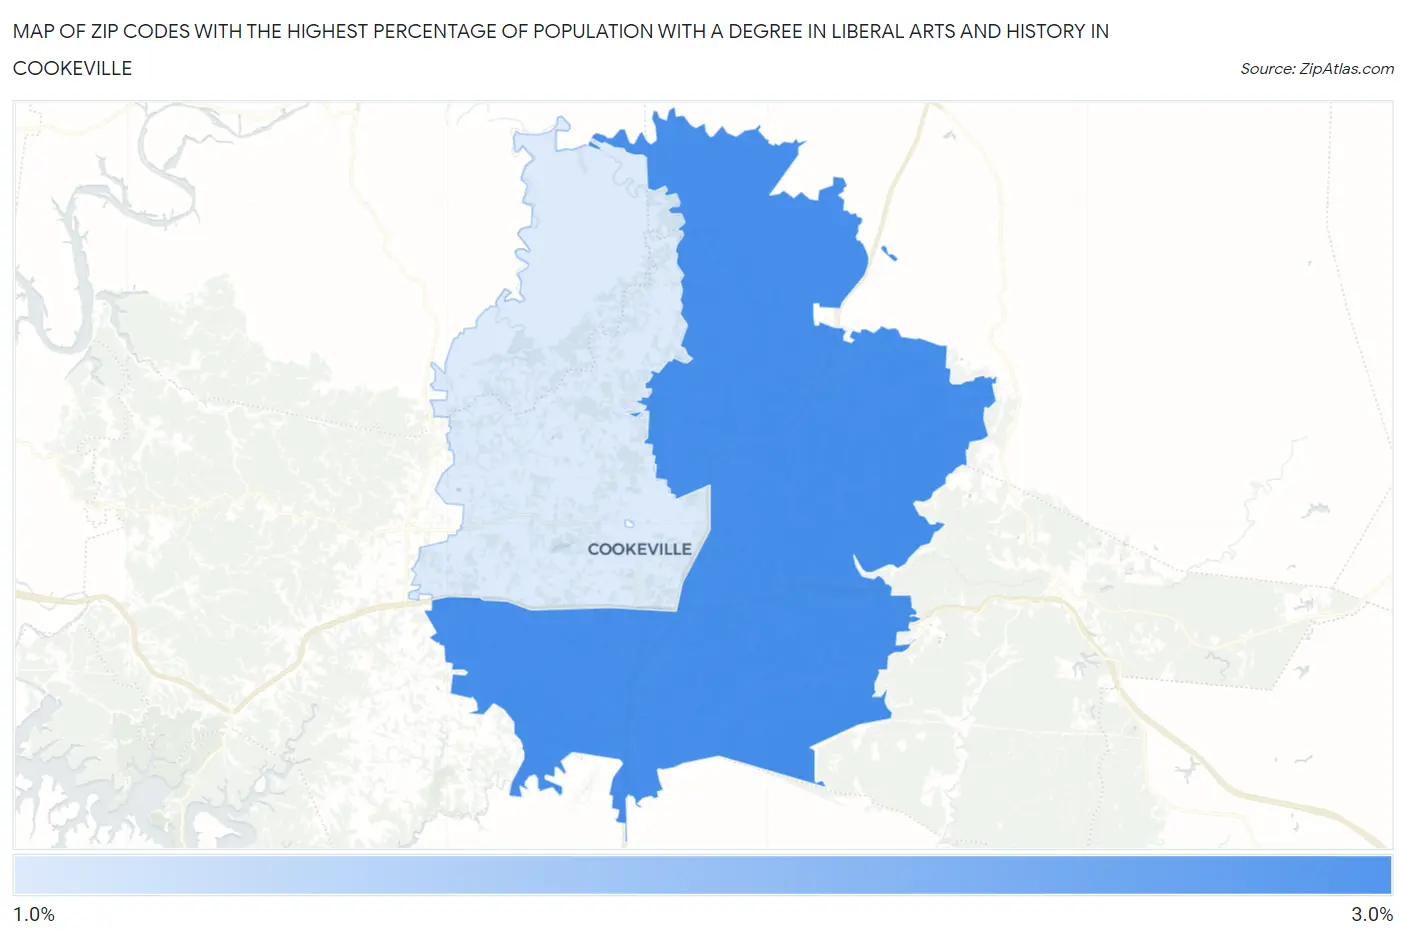
Map of Zip Codes with the Highest Percentage of Population with a Degree in Liberal Arts and History in Cookeville
0.0%
3.0%
Zip Codes with the Highest Percentage of Population with a Degree in Liberal Arts and History in Cookeville, TN
| Zip Code | % Graduates | vs State | vs National | |
| 1. | 38506 | 2.6% | 4.9%(-2.24)#382 | 4.9%(-2.24)#19,537 |
| 2. | 38501 | 2.0% | 4.9%(-2.92)#419 | 4.9%(-2.92)#21,483 |
1
Common Questions
What are the Top Zip Codes with the Highest Percentage of Population with a Degree in Liberal Arts and History in Cookeville, TN?
Top Zip Codes with the Highest Percentage of Population with a Degree in Liberal Arts and History in Cookeville, TN are:
What zip code has the Highest Percentage of Population with a Degree in Liberal Arts and History in Cookeville, TN?
38506 has the Highest Percentage of Population with a Degree in Liberal Arts and History in Cookeville, TN with 2.6%.
What is the Percentage of Population with a Degree in Liberal Arts and History in Cookeville, TN?
Percentage of Population with a Degree in Liberal Arts and History in Cookeville is 2.2%.
What is the Percentage of Population with a Degree in Liberal Arts and History in Tennessee?
Percentage of Population with a Degree in Liberal Arts and History in Tennessee is 4.9%.
What is the Percentage of Population with a Degree in Liberal Arts and History in the United States?
Percentage of Population with a Degree in Liberal Arts and History in the United States is 4.9%.