Zip Codes with the Highest Percentage of Population Employed in Accommodation & Food Services in Germantown, TN
RELATED REPORTS & OPTIONS
Accommodation & Food Services
Germantown
Compare Zip Codes
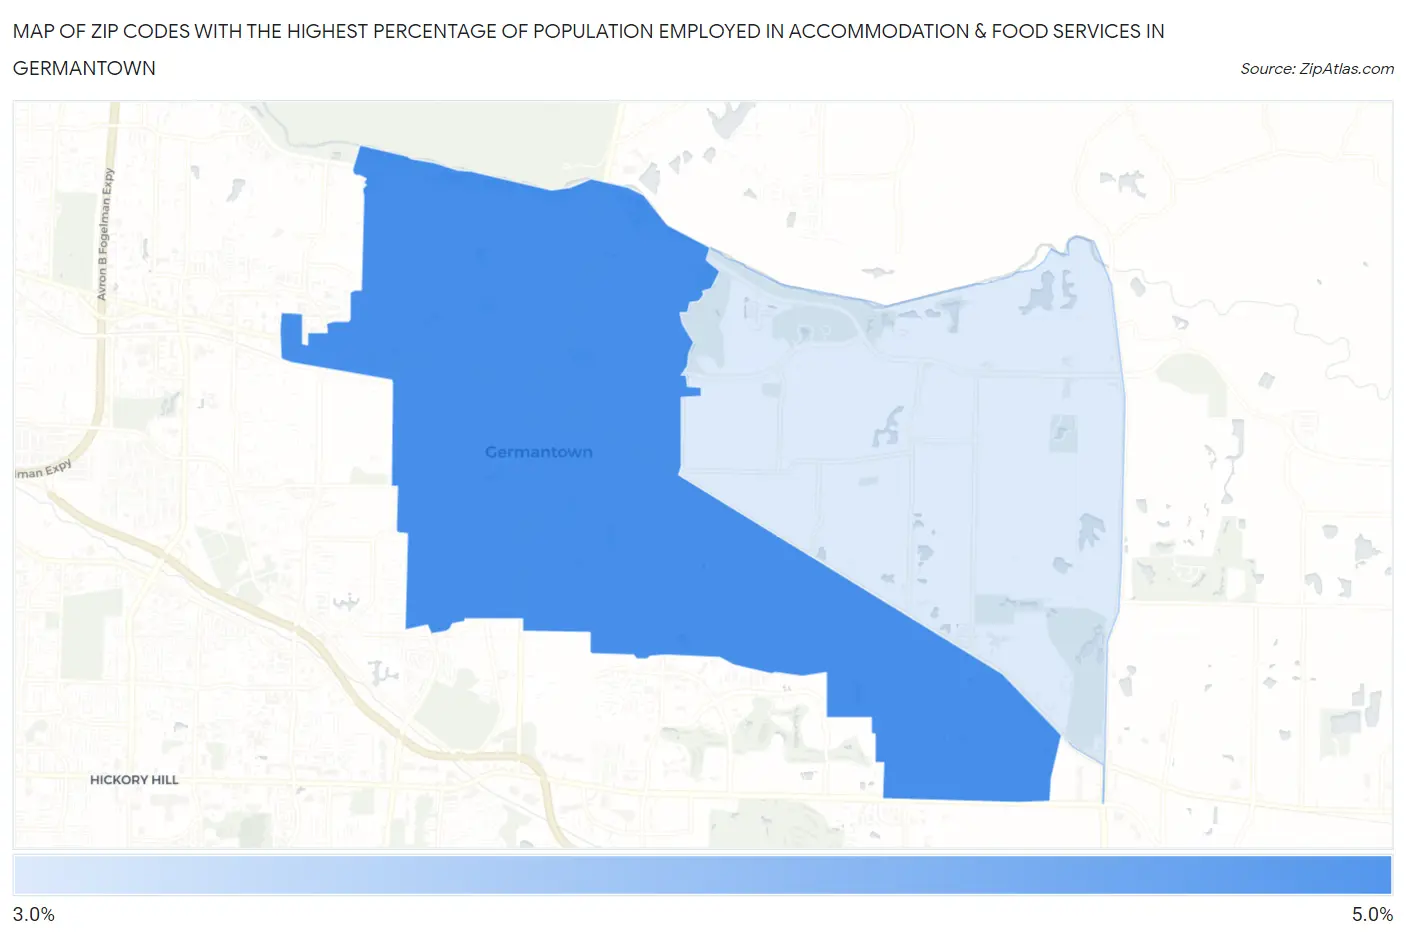
Map of Zip Codes with the Highest Percentage of Population Employed in Accommodation & Food Services in Germantown
0.0%
5.0%
Zip Codes with the Highest Percentage of Population Employed in Accommodation & Food Services in Germantown, TN
| Zip Code | % Employed | vs State | vs National | |
| 1. | 38138 | 4.1% | 7.4%(-3.25)#403 | 6.9%(-2.74)#19,694 |
| 2. | 38139 | 3.7% | 7.4%(-3.73)#441 | 6.9%(-3.22)#21,251 |
1
Common Questions
What are the Top Zip Codes with the Highest Percentage of Population Employed in Accommodation & Food Services in Germantown, TN?
Top Zip Codes with the Highest Percentage of Population Employed in Accommodation & Food Services in Germantown, TN are:
What zip code has the Highest Percentage of Population Employed in Accommodation & Food Services in Germantown, TN?
38138 has the Highest Percentage of Population Employed in Accommodation & Food Services in Germantown, TN with 4.1%.
What is the Percentage of Population Employed in Accommodation & Food Services in Germantown, TN?
Percentage of Population Employed in Accommodation & Food Services in Germantown is 4.0%.
What is the Percentage of Population Employed in Accommodation & Food Services in Tennessee?
Percentage of Population Employed in Accommodation & Food Services in Tennessee is 7.4%.
What is the Percentage of Population Employed in Accommodation & Food Services in the United States?
Percentage of Population Employed in Accommodation & Food Services in the United States is 6.9%.