Zip Codes with the Highest Percentage of Self-Employed / Incorporated in South Dakota
RELATED REPORTS & OPTIONS
Self-Employed / Incorporated
South Dakota
Compare Zip Codes
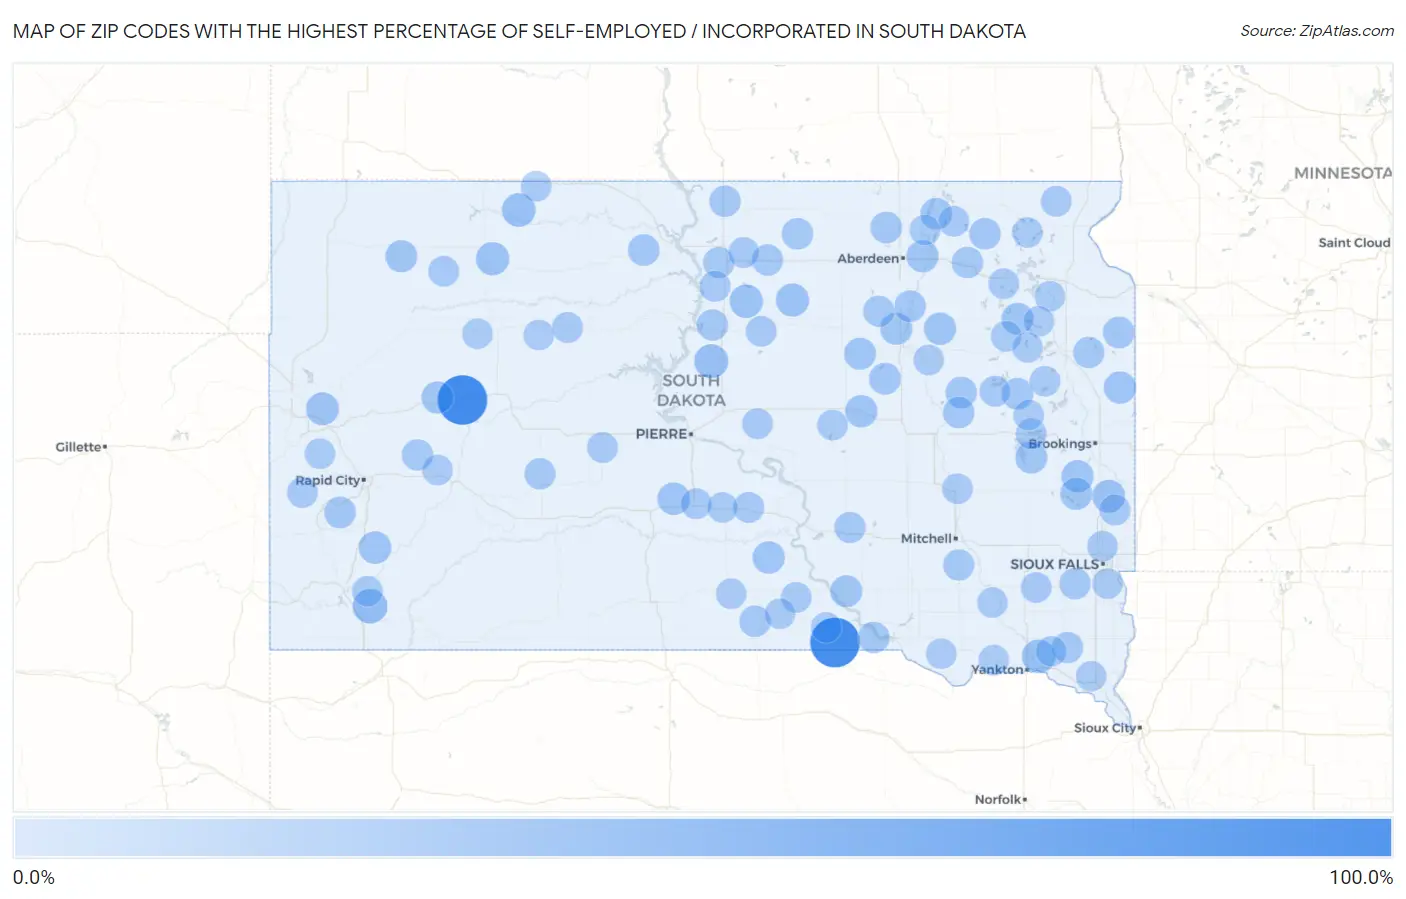
Map of Zip Codes with the Highest Percentage of Self-Employed / Incorporated in South Dakota
0.0%
100.0%
Zip Codes with the Highest Percentage of Self-Employed / Incorporated in South Dakota
| Zip Code | % Self-Employed / Incorporated | vs State | vs National | |
| 1. | 57792 | 100.0% | 4.2%(+95.8)#1 | 3.8%(+96.2)#10 |
| 2. | 57571 | 100.0% | 4.2%(+95.8)#2 | 3.8%(+96.2)#16 |
| 3. | 57782 | 26.3% | 4.2%(+22.1)#3 | 3.8%(+22.5)#284 |
| 4. | 57520 | 24.0% | 4.2%(+19.8)#4 | 3.8%(+20.2)#340 |
| 5. | 57634 | 22.6% | 4.2%(+18.4)#5 | 3.8%(+18.8)#386 |
| 6. | 57046 | 22.1% | 4.2%(+17.9)#6 | 3.8%(+18.3)#403 |
| 7. | 57450 | 21.0% | 4.2%(+16.8)#7 | 3.8%(+17.2)#448 |
| 8. | 57644 | 20.6% | 4.2%(+16.4)#8 | 3.8%(+16.8)#474 |
| 9. | 57466 | 20.0% | 4.2%(+15.8)#9 | 3.8%(+16.2)#510 |
| 10. | 57024 | 18.7% | 4.2%(+14.5)#10 | 3.8%(+14.9)#574 |
| 11. | 57793 | 18.3% | 4.2%(+14.1)#11 | 3.8%(+14.5)#608 |
| 12. | 57738 | 17.2% | 4.2%(+13.0)#12 | 3.8%(+13.4)#691 |
| 13. | 57531 | 17.0% | 4.2%(+12.8)#13 | 3.8%(+13.2)#706 |
| 14. | 57534 | 16.3% | 4.2%(+12.1)#14 | 3.8%(+12.5)#777 |
| 15. | 57477 | 16.3% | 4.2%(+12.1)#15 | 3.8%(+12.5)#779 |
| 16. | 57218 | 16.2% | 4.2%(+12.0)#16 | 3.8%(+12.4)#795 |
| 17. | 57057 | 16.0% | 4.2%(+11.8)#17 | 3.8%(+12.2)#819 |
| 18. | 57373 | 15.8% | 4.2%(+11.6)#18 | 3.8%(+12.0)#847 |
| 19. | 57075 | 15.5% | 4.2%(+11.3)#19 | 3.8%(+11.7)#879 |
| 20. | 57427 | 15.1% | 4.2%(+10.8)#20 | 3.8%(+11.2)#943 |
| 21. | 57424 | 14.9% | 4.2%(+10.7)#21 | 3.8%(+11.1)#969 |
| 22. | 57649 | 14.8% | 4.2%(+10.6)#22 | 3.8%(+11.0)#987 |
| 23. | 57787 | 14.7% | 4.2%(+10.5)#23 | 3.8%(+10.9)#1,008 |
| 24. | 57369 | 14.3% | 4.2%(+10.1)#24 | 3.8%(+10.5)#1,064 |
| 25. | 57051 | 14.3% | 4.2%(+10.1)#25 | 3.8%(+10.5)#1,075 |
| 26. | 57272 | 14.3% | 4.2%(+10.1)#26 | 3.8%(+10.5)#1,076 |
| 27. | 57470 | 14.0% | 4.2%(+9.74)#27 | 3.8%(+10.1)#1,145 |
| 28. | 57476 | 13.7% | 4.2%(+9.51)#28 | 3.8%(+9.91)#1,194 |
| 29. | 57481 | 13.2% | 4.2%(+9.00)#29 | 3.8%(+9.40)#1,273 |
| 30. | 57221 | 13.2% | 4.2%(+8.97)#30 | 3.8%(+9.37)#1,283 |
| 31. | 57461 | 13.1% | 4.2%(+8.89)#31 | 3.8%(+9.29)#1,299 |
| 32. | 57259 | 13.1% | 4.2%(+8.89)#32 | 3.8%(+9.28)#1,301 |
| 33. | 57657 | 13.1% | 4.2%(+8.88)#33 | 3.8%(+9.28)#1,303 |
| 34. | 57751 | 13.0% | 4.2%(+8.80)#34 | 3.8%(+9.20)#1,319 |
| 35. | 57449 | 12.8% | 4.2%(+8.58)#35 | 3.8%(+8.98)#1,358 |
| 36. | 57454 | 12.4% | 4.2%(+8.20)#36 | 3.8%(+8.59)#1,470 |
| 37. | 57322 | 12.3% | 4.2%(+8.10)#37 | 3.8%(+8.50)#1,490 |
| 38. | 57386 | 12.1% | 4.2%(+7.84)#38 | 3.8%(+8.24)#1,550 |
| 39. | 57528 | 11.7% | 4.2%(+7.52)#39 | 3.8%(+7.91)#1,639 |
| 40. | 57448 | 11.6% | 4.2%(+7.40)#40 | 3.8%(+7.80)#1,687 |
| 41. | 57442 | 11.6% | 4.2%(+7.39)#41 | 3.8%(+7.78)#1,692 |
| 42. | 57073 | 11.6% | 4.2%(+7.34)#42 | 3.8%(+7.74)#1,709 |
| 43. | 57335 | 11.5% | 4.2%(+7.24)#43 | 3.8%(+7.64)#1,737 |
| 44. | 57761 | 11.4% | 4.2%(+7.14)#44 | 3.8%(+7.54)#1,760 |
| 45. | 57015 | 11.3% | 4.2%(+7.05)#45 | 3.8%(+7.45)#1,780 |
| 46. | 57422 | 11.3% | 4.2%(+7.03)#46 | 3.8%(+7.43)#1,788 |
| 47. | 57428 | 11.2% | 4.2%(+7.03)#47 | 3.8%(+7.43)#1,790 |
| 48. | 57632 | 11.2% | 4.2%(+6.99)#48 | 3.8%(+7.39)#1,807 |
| 49. | 57238 | 11.2% | 4.2%(+6.97)#49 | 3.8%(+7.37)#1,811 |
| 50. | 57465 | 10.5% | 4.2%(+6.31)#50 | 3.8%(+6.71)#2,089 |
| 51. | 57355 | 10.5% | 4.2%(+6.28)#51 | 3.8%(+6.68)#2,099 |
| 52. | 57567 | 10.4% | 4.2%(+6.22)#52 | 3.8%(+6.62)#2,115 |
| 53. | 57472 | 10.3% | 4.2%(+6.10)#53 | 3.8%(+6.49)#2,167 |
| 54. | 57334 | 10.3% | 4.2%(+6.07)#54 | 3.8%(+6.47)#2,179 |
| 55. | 57636 | 9.8% | 4.2%(+5.59)#55 | 3.8%(+5.99)#2,414 |
| 56. | 57420 | 9.7% | 4.2%(+5.46)#56 | 3.8%(+5.86)#2,479 |
| 57. | 57452 | 9.2% | 4.2%(+5.02)#57 | 3.8%(+5.41)#2,739 |
| 58. | 57544 | 9.2% | 4.2%(+4.97)#58 | 3.8%(+5.37)#2,767 |
| 59. | 57278 | 9.1% | 4.2%(+4.93)#59 | 3.8%(+5.33)#2,791 |
| 60. | 57745 | 9.1% | 4.2%(+4.91)#60 | 3.8%(+5.31)#2,800 |
| 61. | 57620 | 9.1% | 4.2%(+4.90)#61 | 3.8%(+5.30)#2,804 |
| 62. | 57552 | 9.1% | 4.2%(+4.88)#62 | 3.8%(+5.27)#2,818 |
| 63. | 57065 | 9.1% | 4.2%(+4.88)#63 | 3.8%(+5.27)#2,820 |
| 64. | 57455 | 9.1% | 4.2%(+4.88)#64 | 3.8%(+5.27)#2,830 |
| 65. | 57576 | 9.1% | 4.2%(+4.88)#65 | 3.8%(+5.27)#2,835 |
| 66. | 57249 | 9.0% | 4.2%(+4.81)#66 | 3.8%(+5.21)#2,865 |
| 67. | 57224 | 8.9% | 4.2%(+4.70)#67 | 3.8%(+5.09)#2,935 |
| 68. | 57536 | 8.7% | 4.2%(+4.53)#68 | 3.8%(+4.93)#3,043 |
| 69. | 57043 | 8.6% | 4.2%(+4.38)#69 | 3.8%(+4.77)#3,157 |
| 70. | 57274 | 8.5% | 4.2%(+4.28)#70 | 3.8%(+4.68)#3,233 |
| 71. | 57236 | 8.5% | 4.2%(+4.26)#71 | 3.8%(+4.66)#3,251 |
| 72. | 57432 | 8.5% | 4.2%(+4.25)#72 | 3.8%(+4.64)#3,262 |
| 73. | 57533 | 8.4% | 4.2%(+4.22)#73 | 3.8%(+4.62)#3,281 |
| 74. | 57362 | 8.4% | 4.2%(+4.22)#74 | 3.8%(+4.62)#3,282 |
| 75. | 57766 | 8.3% | 4.2%(+4.12)#75 | 3.8%(+4.52)#3,373 |
| 76. | 57055 | 8.3% | 4.2%(+4.05)#76 | 3.8%(+4.45)#3,426 |
| 77. | 57233 | 8.2% | 4.2%(+3.97)#77 | 3.8%(+4.36)#3,491 |
| 78. | 57732 | 8.2% | 4.2%(+3.95)#78 | 3.8%(+4.35)#3,506 |
| 79. | 57538 | 8.1% | 4.2%(+3.93)#79 | 3.8%(+4.33)#3,520 |
| 80. | 57433 | 8.1% | 4.2%(+3.91)#80 | 3.8%(+4.30)#3,549 |
| 81. | 57440 | 8.1% | 4.2%(+3.89)#81 | 3.8%(+4.29)#3,564 |
| 82. | 57645 | 8.1% | 4.2%(+3.89)#82 | 3.8%(+4.29)#3,568 |
| 83. | 57767 | 8.1% | 4.2%(+3.85)#83 | 3.8%(+4.25)#3,616 |
| 84. | 57314 | 8.1% | 4.2%(+3.84)#84 | 3.8%(+4.23)#3,624 |
| 85. | 57241 | 8.0% | 4.2%(+3.78)#85 | 3.8%(+4.18)#3,660 |
| 86. | 57063 | 7.8% | 4.2%(+3.58)#86 | 3.8%(+3.98)#3,869 |
| 87. | 57256 | 7.8% | 4.2%(+3.56)#87 | 3.8%(+3.96)#3,889 |
| 88. | 57529 | 7.8% | 4.2%(+3.56)#88 | 3.8%(+3.95)#3,892 |
| 89. | 57626 | 7.7% | 4.2%(+3.50)#89 | 3.8%(+3.89)#3,953 |
| 90. | 57235 | 7.7% | 4.2%(+3.50)#90 | 3.8%(+3.89)#3,954 |
| 91. | 57568 | 7.5% | 4.2%(+3.31)#91 | 3.8%(+3.71)#4,144 |
| 92. | 57623 | 7.5% | 4.2%(+3.28)#92 | 3.8%(+3.68)#4,175 |
| 93. | 57580 | 7.5% | 4.2%(+3.26)#93 | 3.8%(+3.66)#4,185 |
| 94. | 57072 | 7.5% | 4.2%(+3.26)#94 | 3.8%(+3.66)#4,187 |
| 95. | 57329 | 7.4% | 4.2%(+3.21)#95 | 3.8%(+3.61)#4,243 |
| 96. | 57243 | 7.4% | 4.2%(+3.19)#96 | 3.8%(+3.59)#4,265 |
| 97. | 57232 | 7.4% | 4.2%(+3.18)#97 | 3.8%(+3.58)#4,283 |
| 98. | 57010 | 7.3% | 4.2%(+3.12)#98 | 3.8%(+3.51)#4,359 |
| 99. | 57032 | 7.3% | 4.2%(+3.09)#99 | 3.8%(+3.49)#4,387 |
| 100. | 57052 | 7.3% | 4.2%(+3.07)#100 | 3.8%(+3.47)#4,413 |
Common Questions
What are the Top 10 Zip Codes with the Highest Percentage of Self-Employed / Incorporated in South Dakota?
Top 10 Zip Codes with the Highest Percentage of Self-Employed / Incorporated in South Dakota are:
What zip code has the Highest Percentage of Self-Employed / Incorporated in South Dakota?
57792 has the Highest Percentage of Self-Employed / Incorporated in South Dakota with 100.0%.
What is the Percentage of Self-Employed / Incorporated in the State of South Dakota?
Percentage of Self-Employed / Incorporated in South Dakota is 4.2%.
What is the Percentage of Self-Employed / Incorporated in the United States?
Percentage of Self-Employed / Incorporated in the United States is 3.8%.