Zip Codes with the Highest Percentage of Population Employed in Food Preparation & Serving in Sioux Falls, SD
RELATED REPORTS & OPTIONS
Food Preparation & Serving
Sioux Falls
Compare Zip Codes
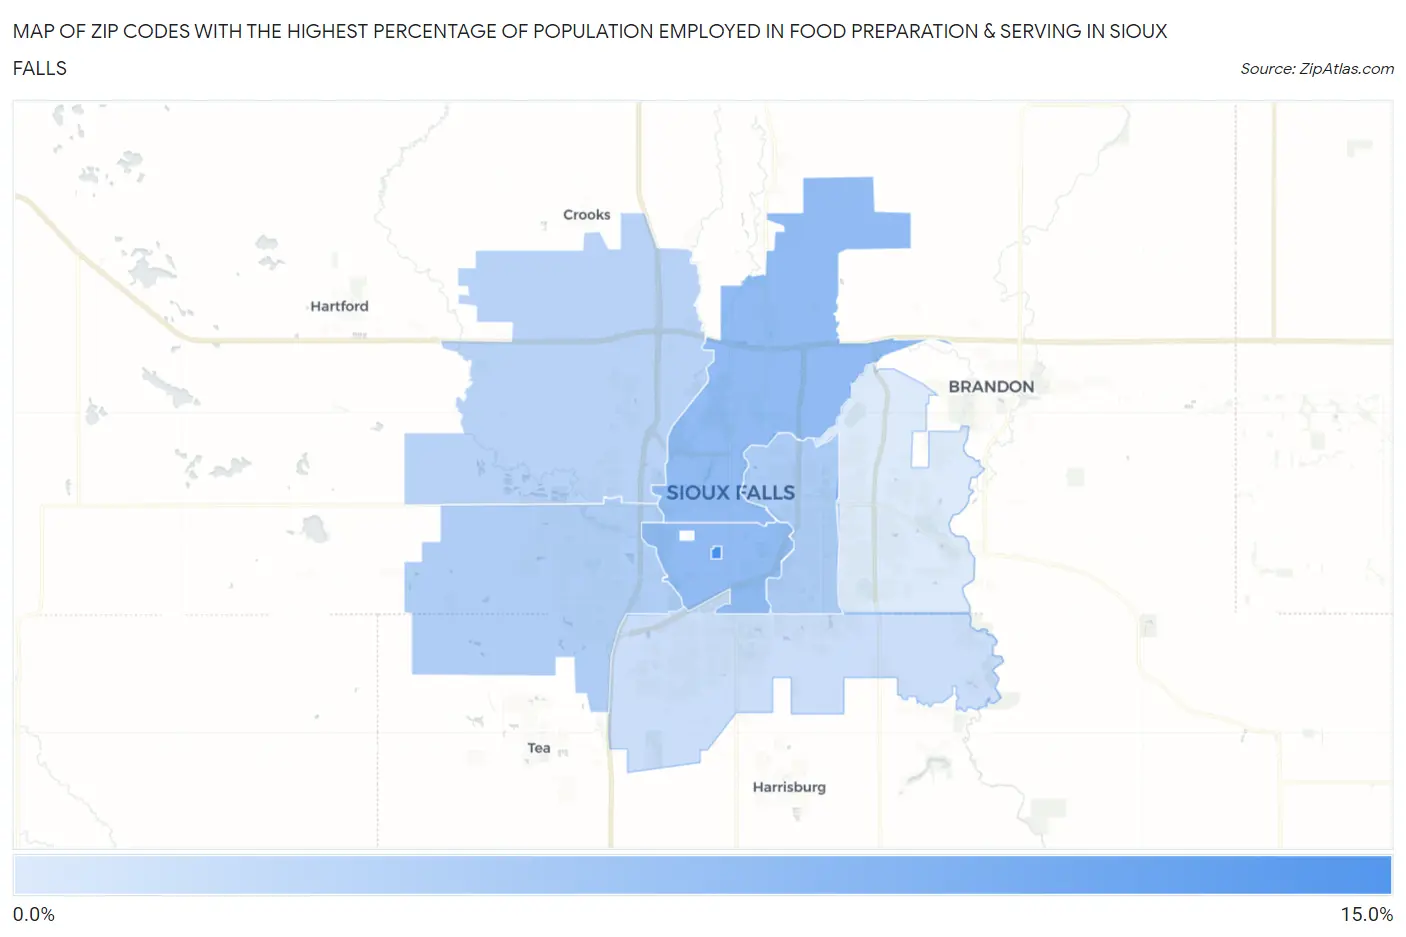
Map of Zip Codes with the Highest Percentage of Population Employed in Food Preparation & Serving in Sioux Falls
0.0%
15.0%
Zip Codes with the Highest Percentage of Population Employed in Food Preparation & Serving in Sioux Falls, SD
| Zip Code | % Employed | vs State | vs National | |
| 1. | 57197 | 13.2% | 5.7%(+7.53)#15 | 5.3%(+7.90)#1,341 |
| 2. | 57104 | 7.9% | 5.7%(+2.22)#52 | 5.3%(+2.60)#4,912 |
| 3. | 57105 | 7.9% | 5.7%(+2.21)#54 | 5.3%(+2.58)#4,933 |
| 4. | 57103 | 6.0% | 5.7%(+0.311)#95 | 5.3%(+0.686)#9,437 |
| 5. | 57106 | 5.9% | 5.7%(+0.192)#97 | 5.3%(+0.567)#9,854 |
| 6. | 57107 | 5.2% | 5.7%(-0.500)#115 | 5.3%(-0.124)#12,314 |
| 7. | 57108 | 3.9% | 5.7%(-1.71)#159 | 5.3%(-1.34)#17,346 |
| 8. | 57110 | 2.7% | 5.7%(-2.93)#206 | 5.3%(-2.55)#22,300 |
1
Common Questions
What are the Top 5 Zip Codes with the Highest Percentage of Population Employed in Food Preparation & Serving in Sioux Falls, SD?
Top 5 Zip Codes with the Highest Percentage of Population Employed in Food Preparation & Serving in Sioux Falls, SD are:
What zip code has the Highest Percentage of Population Employed in Food Preparation & Serving in Sioux Falls, SD?
57197 has the Highest Percentage of Population Employed in Food Preparation & Serving in Sioux Falls, SD with 13.2%.
What is the Percentage of Population Employed in Food Preparation & Serving in Sioux Falls, SD?
Percentage of Population Employed in Food Preparation & Serving in Sioux Falls is 5.8%.
What is the Percentage of Population Employed in Food Preparation & Serving in South Dakota?
Percentage of Population Employed in Food Preparation & Serving in South Dakota is 5.7%.
What is the Percentage of Population Employed in Food Preparation & Serving in the United States?
Percentage of Population Employed in Food Preparation & Serving in the United States is 5.3%.