Zip Codes with the Highest Percentage of Population Employed in Food Preparation & Serving in Rapid City, SD
RELATED REPORTS & OPTIONS
Food Preparation & Serving
Rapid City
Compare Zip Codes
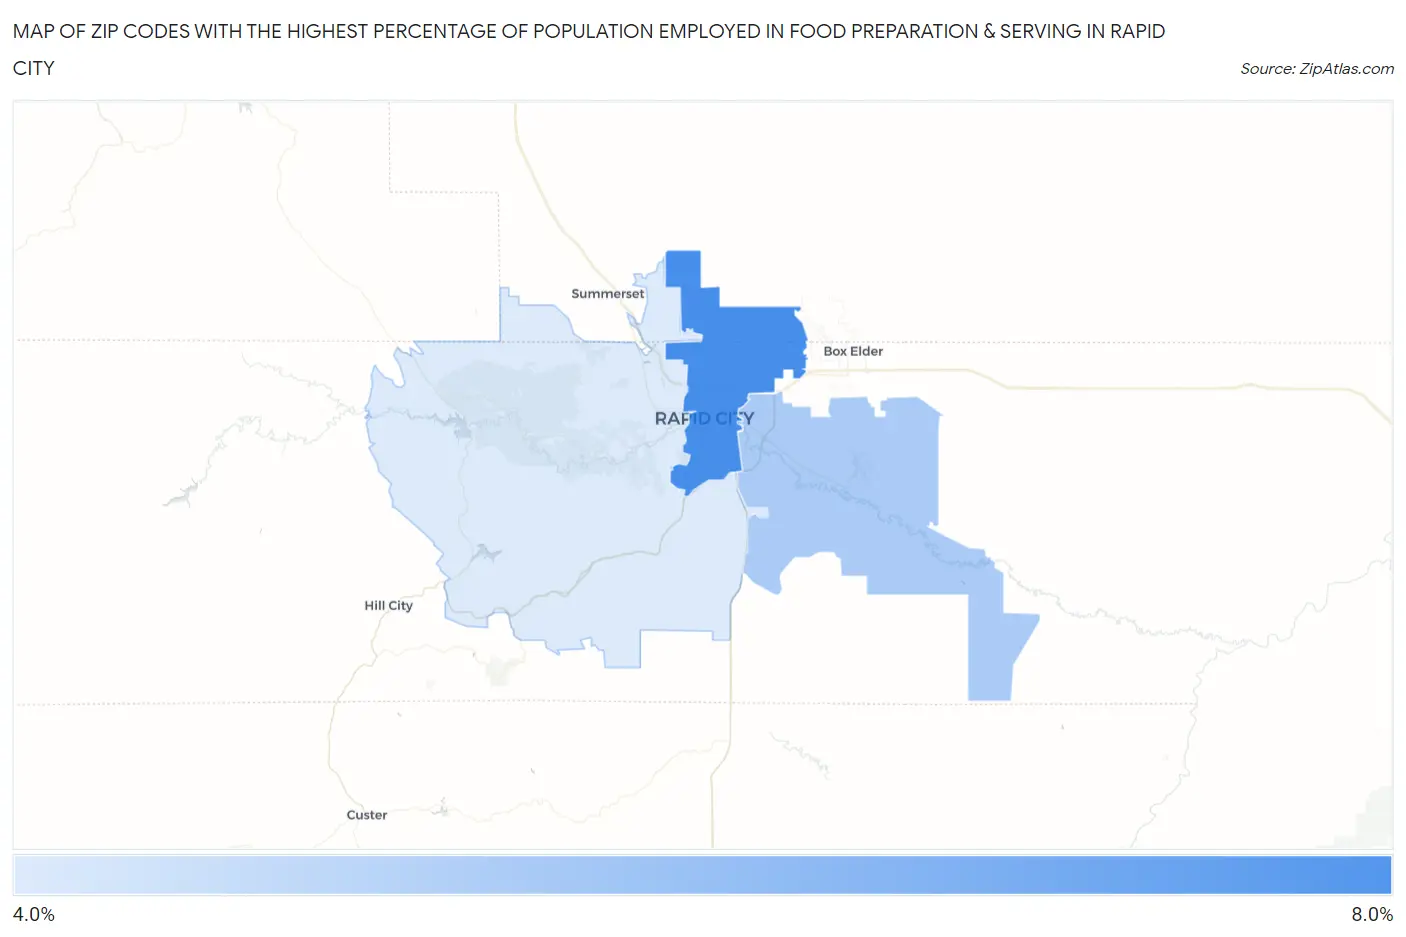
Map of Zip Codes with the Highest Percentage of Population Employed in Food Preparation & Serving in Rapid City
0.0%
8.0%
Zip Codes with the Highest Percentage of Population Employed in Food Preparation & Serving in Rapid City, SD
| Zip Code | % Employed | vs State | vs National | |
| 1. | 57701 | 7.7% | 5.7%(+2.02)#60 | 5.3%(+2.40)#5,240 |
| 2. | 57703 | 5.3% | 5.7%(-0.354)#111 | 5.3%(+0.021)#11,735 |
| 3. | 57702 | 4.1% | 5.7%(-1.56)#154 | 5.3%(-1.19)#16,715 |
1
Common Questions
What are the Top Zip Codes with the Highest Percentage of Population Employed in Food Preparation & Serving in Rapid City, SD?
Top Zip Codes with the Highest Percentage of Population Employed in Food Preparation & Serving in Rapid City, SD are:
What zip code has the Highest Percentage of Population Employed in Food Preparation & Serving in Rapid City, SD?
57701 has the Highest Percentage of Population Employed in Food Preparation & Serving in Rapid City, SD with 7.7%.
What is the Percentage of Population Employed in Food Preparation & Serving in Rapid City, SD?
Percentage of Population Employed in Food Preparation & Serving in Rapid City is 6.2%.
What is the Percentage of Population Employed in Food Preparation & Serving in South Dakota?
Percentage of Population Employed in Food Preparation & Serving in South Dakota is 5.7%.
What is the Percentage of Population Employed in Food Preparation & Serving in the United States?
Percentage of Population Employed in Food Preparation & Serving in the United States is 5.3%.