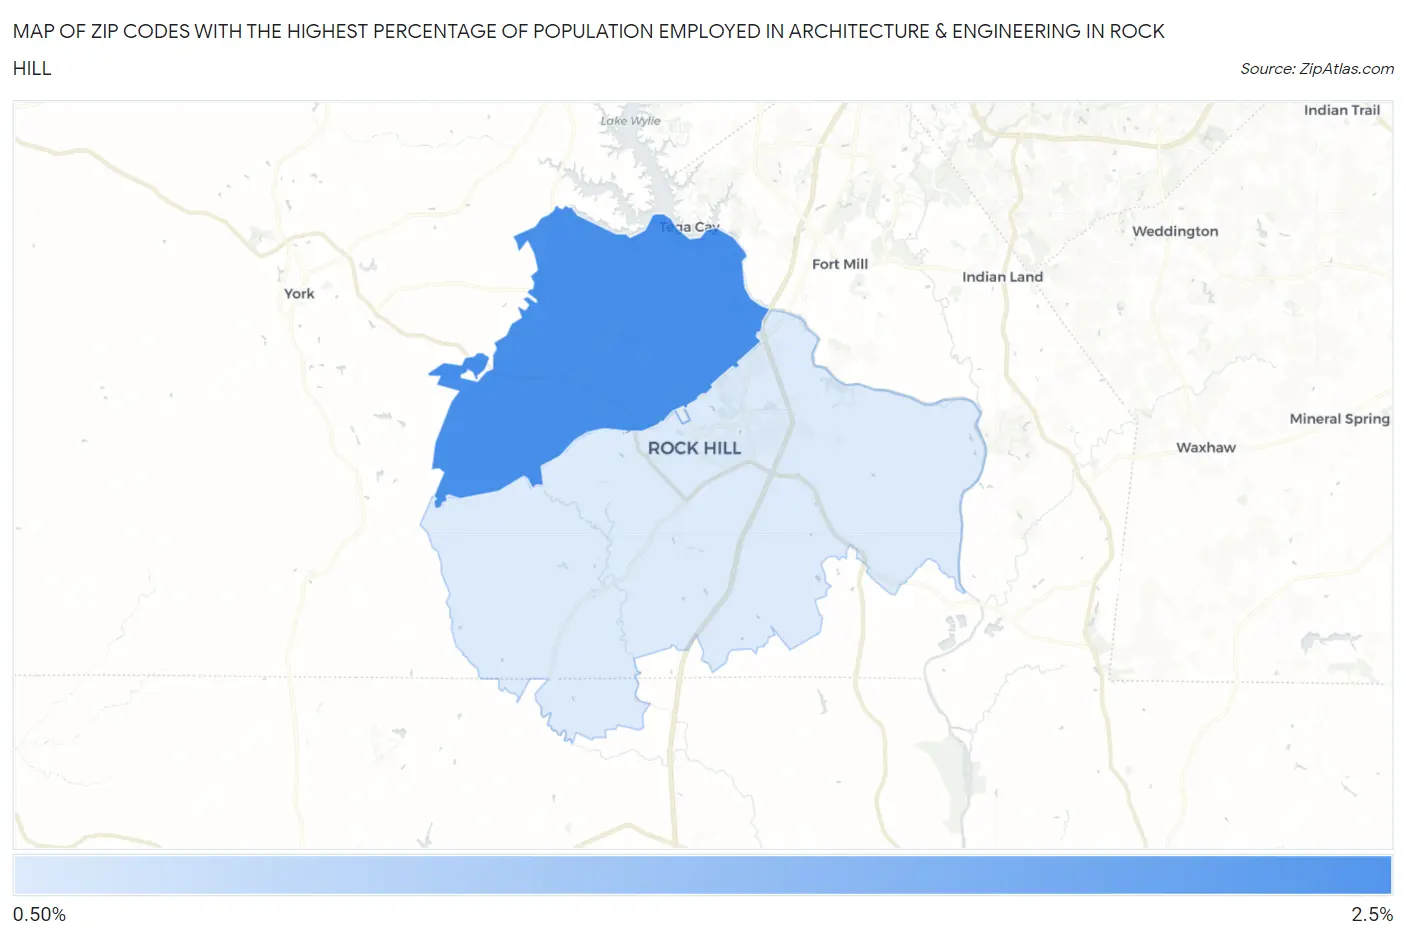
Zip Codes with the Highest Percentage of Population Employed in Architecture & Engineering in Rock Hill, SC
RELATED REPORTS & OPTIONS
Architecture & Engineering
Rock Hill
Compare Zip Codes
Map of Zip Codes with the Highest Percentage of Population Employed in Architecture & Engineering in Rock Hill
0.0%
2.5%
Zip Codes with the Highest Percentage of Population Employed in Architecture & Engineering in Rock Hill, SC
| Zip Code | % Employed | vs State | vs National | |
| 1. | 29732 | 2.0% | 2.2%(-0.169)#125 | 2.1%(-0.122)#9,436 |
| 2. | 29730 | 1.4% | 2.2%(-0.783)#176 | 2.1%(-0.736)#13,490 |
1
Common Questions
What are the Top Zip Codes with the Highest Percentage of Population Employed in Architecture & Engineering in Rock Hill, SC?
Top Zip Codes with the Highest Percentage of Population Employed in Architecture & Engineering in Rock Hill, SC are:
What zip code has the Highest Percentage of Population Employed in Architecture & Engineering in Rock Hill, SC?
29732 has the Highest Percentage of Population Employed in Architecture & Engineering in Rock Hill, SC with 2.0%.
What is the Percentage of Population Employed in Architecture & Engineering in Rock Hill, SC?
Percentage of Population Employed in Architecture & Engineering in Rock Hill is 1.5%.
What is the Percentage of Population Employed in Architecture & Engineering in South Carolina?
Percentage of Population Employed in Architecture & Engineering in South Carolina is 2.2%.
What is the Percentage of Population Employed in Architecture & Engineering in the United States?
Percentage of Population Employed in Architecture & Engineering in the United States is 2.1%.