Zip Codes with the Highest Percentage of Population Employed in Architecture & Engineering in Easley, SC
RELATED REPORTS & OPTIONS
Architecture & Engineering
Easley
Compare Zip Codes
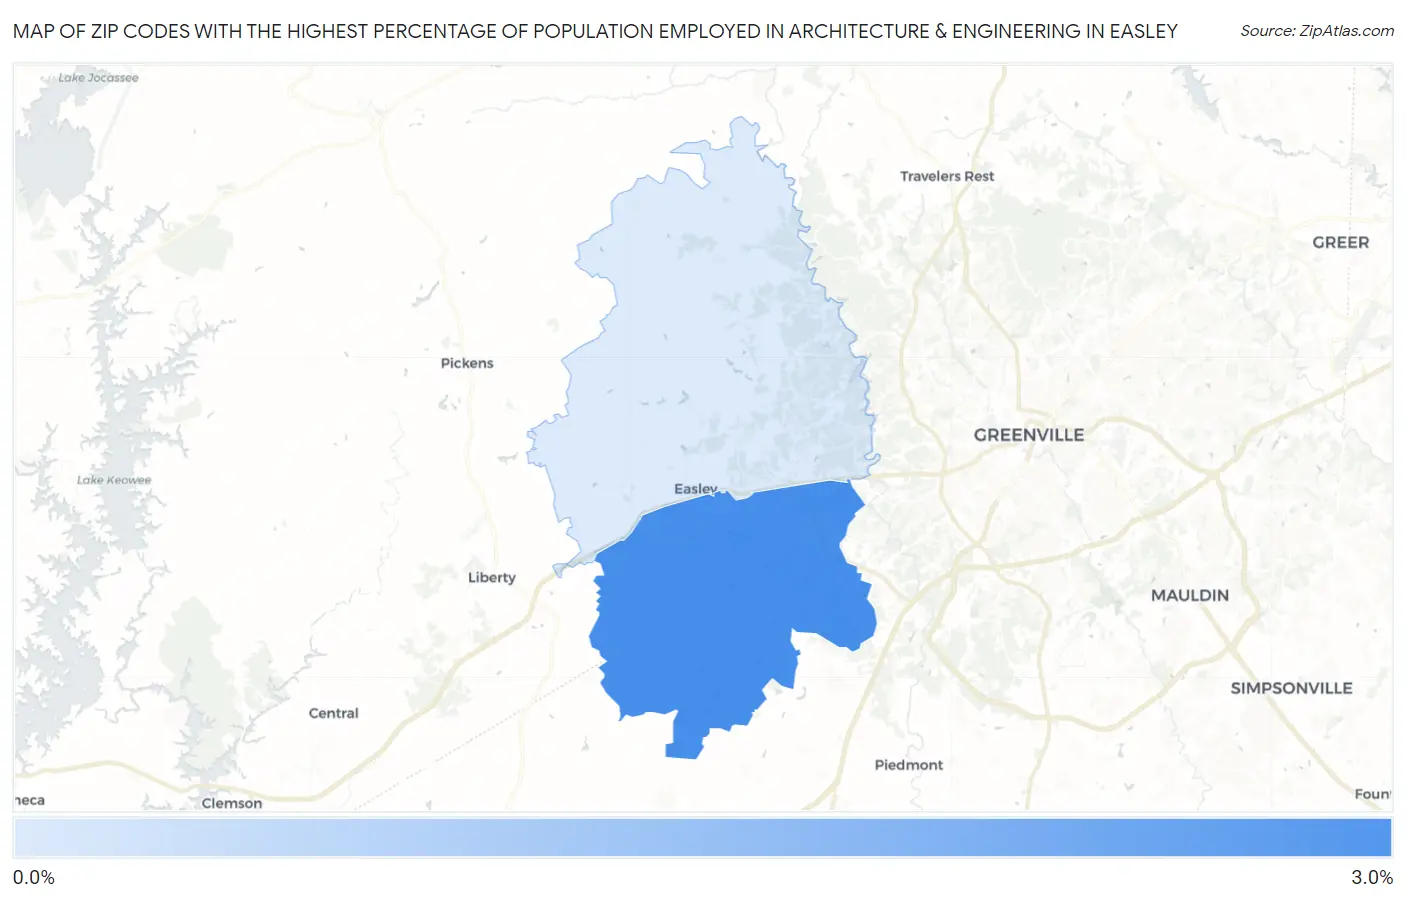
Map of Zip Codes with the Highest Percentage of Population Employed in Architecture & Engineering in Easley
0.0%
3.0%
Zip Codes with the Highest Percentage of Population Employed in Architecture & Engineering in Easley, SC
| Zip Code | % Employed | vs State | vs National | |
| 1. | 29642 | 2.6% | 2.2%(+0.373)#93 | 2.1%(+0.420)#6,702 |
| 2. | 29640 | 0.68% | 2.2%(-1.51)#264 | 2.1%(-1.47)#19,007 |
1
Common Questions
What are the Top Zip Codes with the Highest Percentage of Population Employed in Architecture & Engineering in Easley, SC?
Top Zip Codes with the Highest Percentage of Population Employed in Architecture & Engineering in Easley, SC are:
What zip code has the Highest Percentage of Population Employed in Architecture & Engineering in Easley, SC?
29642 has the Highest Percentage of Population Employed in Architecture & Engineering in Easley, SC with 2.6%.
What is the Percentage of Population Employed in Architecture & Engineering in Easley, SC?
Percentage of Population Employed in Architecture & Engineering in Easley is 1.9%.
What is the Percentage of Population Employed in Architecture & Engineering in South Carolina?
Percentage of Population Employed in Architecture & Engineering in South Carolina is 2.2%.
What is the Percentage of Population Employed in Architecture & Engineering in the United States?
Percentage of Population Employed in Architecture & Engineering in the United States is 2.1%.