Zip Codes with the Highest Percentage of Population Employed in Security & Protection in San Juan, PR
RELATED REPORTS & OPTIONS
Security & Protection
San Juan
Compare Zip Codes
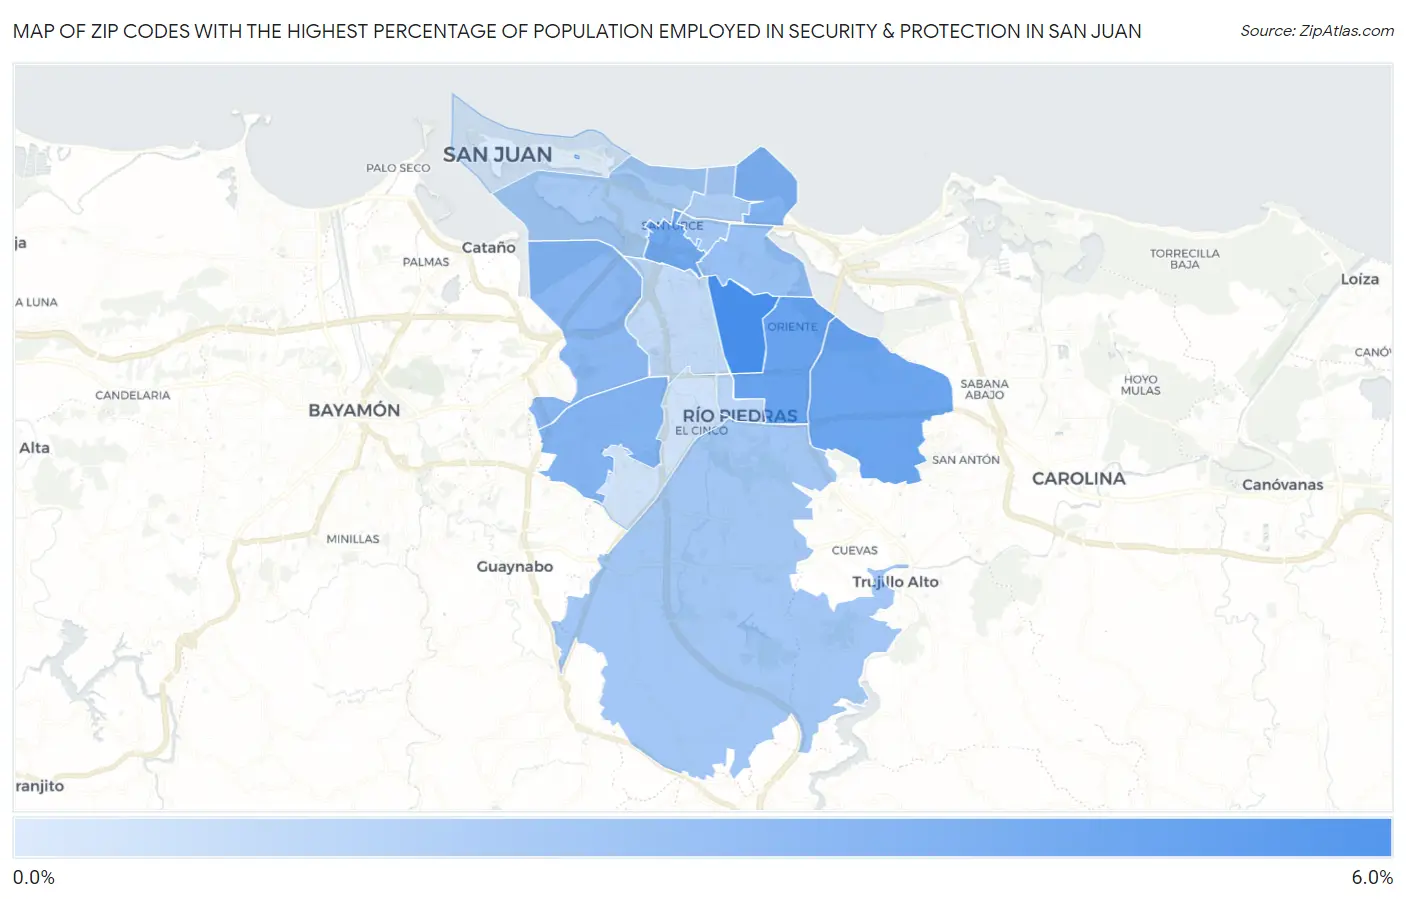
Map of Zip Codes with the Highest Percentage of Population Employed in Security & Protection in San Juan
0.0%
6.0%
Zip Codes with the Highest Percentage of Population Employed in Security & Protection in San Juan, PR
| Zip Code | % Employed | vs State | vs National | |
| 1. | 00917 | 5.7% | 4.9%(+0.729)#48 | 2.1%(+3.52)#2,309 |
| 2. | 00923 | 4.4% | 4.9%(-0.553)#66 | 2.1%(+2.24)#3,796 |
| 3. | 00924 | 4.3% | 4.9%(-0.603)#69 | 2.1%(+2.19)#3,881 |
| 4. | 00909 | 4.1% | 4.9%(-0.881)#73 | 2.1%(+1.91)#4,375 |
| 5. | 00913 | 3.6% | 4.9%(-1.37)#91 | 2.1%(+1.42)#5,491 |
| 6. | 00921 | 3.5% | 4.9%(-1.40)#92 | 2.1%(+1.39)#5,571 |
| 7. | 00920 | 3.3% | 4.9%(-1.65)#94 | 2.1%(+1.14)#6,270 |
| 8. | 00915 | 2.8% | 4.9%(-2.19)#101 | 2.1%(+0.604)#8,303 |
| 9. | 00912 | 2.4% | 4.9%(-2.57)#104 | 2.1%(+0.219)#10,238 |
| 10. | 00926 | 2.3% | 4.9%(-2.60)#105 | 2.1%(+0.191)#10,403 |
| 11. | 00907 | 2.2% | 4.9%(-2.75)#108 | 2.1%(+0.043)#11,310 |
| 12. | 00911 | 2.1% | 4.9%(-2.87)#109 | 2.1%(-0.078)#12,109 |
| 13. | 00925 | 1.5% | 4.9%(-3.45)#113 | 2.1%(-0.660)#16,305 |
| 14. | 00918 | 1.3% | 4.9%(-3.65)#115 | 2.1%(-0.855)#17,791 |
| 15. | 00927 | 0.79% | 4.9%(-4.15)#119 | 2.1%(-1.36)#21,472 |
| 16. | 00901 | 0.37% | 4.9%(-4.57)#121 | 2.1%(-1.78)#23,862 |
1
Common Questions
What are the Top 10 Zip Codes with the Highest Percentage of Population Employed in Security & Protection in San Juan, PR?
Top 10 Zip Codes with the Highest Percentage of Population Employed in Security & Protection in San Juan, PR are:
What zip code has the Highest Percentage of Population Employed in Security & Protection in San Juan, PR?
00917 has the Highest Percentage of Population Employed in Security & Protection in San Juan, PR with 5.7%.
What is the Percentage of Population Employed in Security & Protection in San Juan, PR?
Percentage of Population Employed in Security & Protection in San Juan is 2.7%.
What is the Percentage of Population Employed in Security & Protection in Puerto Rico?
Percentage of Population Employed in Security & Protection in Puerto Rico is 4.9%.
What is the Percentage of Population Employed in Security & Protection in the United States?
Percentage of Population Employed in Security & Protection in the United States is 2.1%.