Zip Codes with the Highest Percentage of Population Employed in Life, Physical & Social Science in San Juan, PR
RELATED REPORTS & OPTIONS
Life, Physical & Social Science
San Juan
Compare Zip Codes
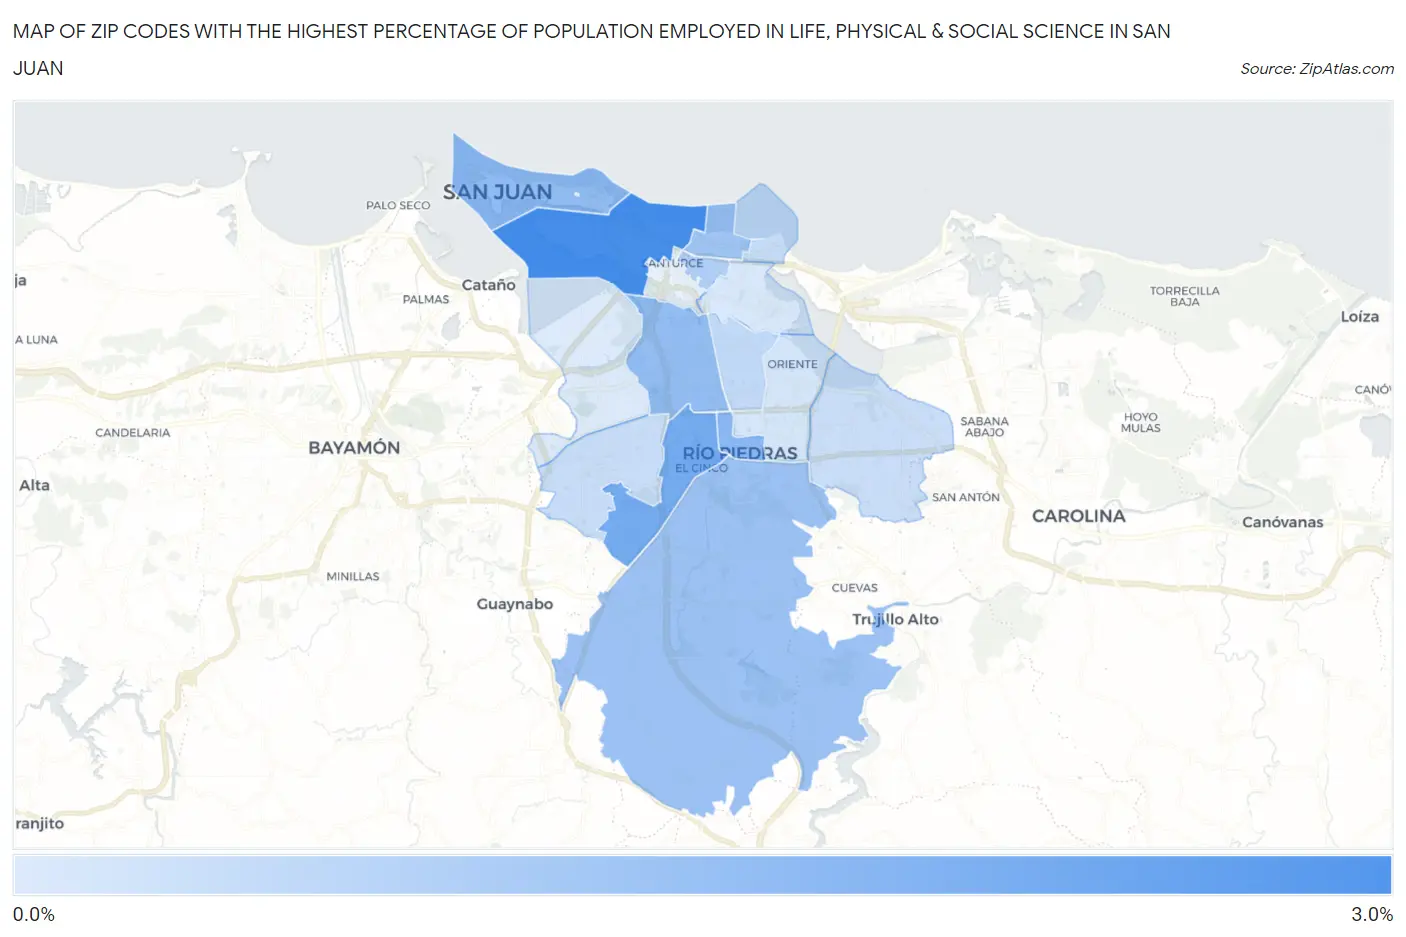
Map of Zip Codes with the Highest Percentage of Population Employed in Life, Physical & Social Science in San Juan
0.0%
3.0%
Zip Codes with the Highest Percentage of Population Employed in Life, Physical & Social Science in San Juan, PR
| Zip Code | % Employed | vs State | vs National | |
| 1. | 00907 | 2.9% | 0.79%(+2.10)#2 | 1.1%(+1.81)#2,000 |
| 2. | 00927 | 2.0% | 0.79%(+1.25)#8 | 1.1%(+0.957)#3,549 |
| 3. | 00925 | 1.6% | 0.79%(+0.847)#14 | 1.1%(+0.550)#4,988 |
| 4. | 00901 | 1.5% | 0.79%(+0.735)#18 | 1.1%(+0.438)#5,503 |
| 5. | 00918 | 1.5% | 0.79%(+0.661)#19 | 1.1%(+0.365)#5,894 |
| 6. | 00926 | 1.3% | 0.79%(+0.513)#27 | 1.1%(+0.216)#6,766 |
| 7. | 00911 | 1.3% | 0.79%(+0.478)#30 | 1.1%(+0.181)#6,989 |
| 8. | 00912 | 0.92% | 0.79%(+0.125)#42 | 1.1%(-0.172)#9,776 |
| 9. | 00917 | 0.59% | 0.79%(-0.200)#68 | 1.1%(-0.497)#13,372 |
| 10. | 00913 | 0.53% | 0.79%(-0.266)#71 | 1.1%(-0.563)#14,177 |
| 11. | 00921 | 0.48% | 0.79%(-0.316)#74 | 1.1%(-0.613)#14,797 |
| 12. | 00924 | 0.45% | 0.79%(-0.340)#77 | 1.1%(-0.636)#15,081 |
| 13. | 00923 | 0.23% | 0.79%(-0.568)#93 | 1.1%(-0.864)#17,898 |
| 14. | 00915 | 0.21% | 0.79%(-0.586)#94 | 1.1%(-0.883)#18,114 |
| 15. | 00920 | 0.11% | 0.79%(-0.688)#103 | 1.1%(-0.985)#19,042 |
1
Common Questions
What are the Top 10 Zip Codes with the Highest Percentage of Population Employed in Life, Physical & Social Science in San Juan, PR?
Top 10 Zip Codes with the Highest Percentage of Population Employed in Life, Physical & Social Science in San Juan, PR are:
What zip code has the Highest Percentage of Population Employed in Life, Physical & Social Science in San Juan, PR?
00907 has the Highest Percentage of Population Employed in Life, Physical & Social Science in San Juan, PR with 2.9%.
What is the Percentage of Population Employed in Life, Physical & Social Science in San Juan, PR?
Percentage of Population Employed in Life, Physical & Social Science in San Juan is 1.1%.
What is the Percentage of Population Employed in Life, Physical & Social Science in Puerto Rico?
Percentage of Population Employed in Life, Physical & Social Science in Puerto Rico is 0.79%.
What is the Percentage of Population Employed in Life, Physical & Social Science in the United States?
Percentage of Population Employed in Life, Physical & Social Science in the United States is 1.1%.