Zip Codes with the Highest Percentage of Population Employed in Security & Protection in Bayamon, PR
RELATED REPORTS & OPTIONS
Security & Protection
Bayamon
Compare Zip Codes
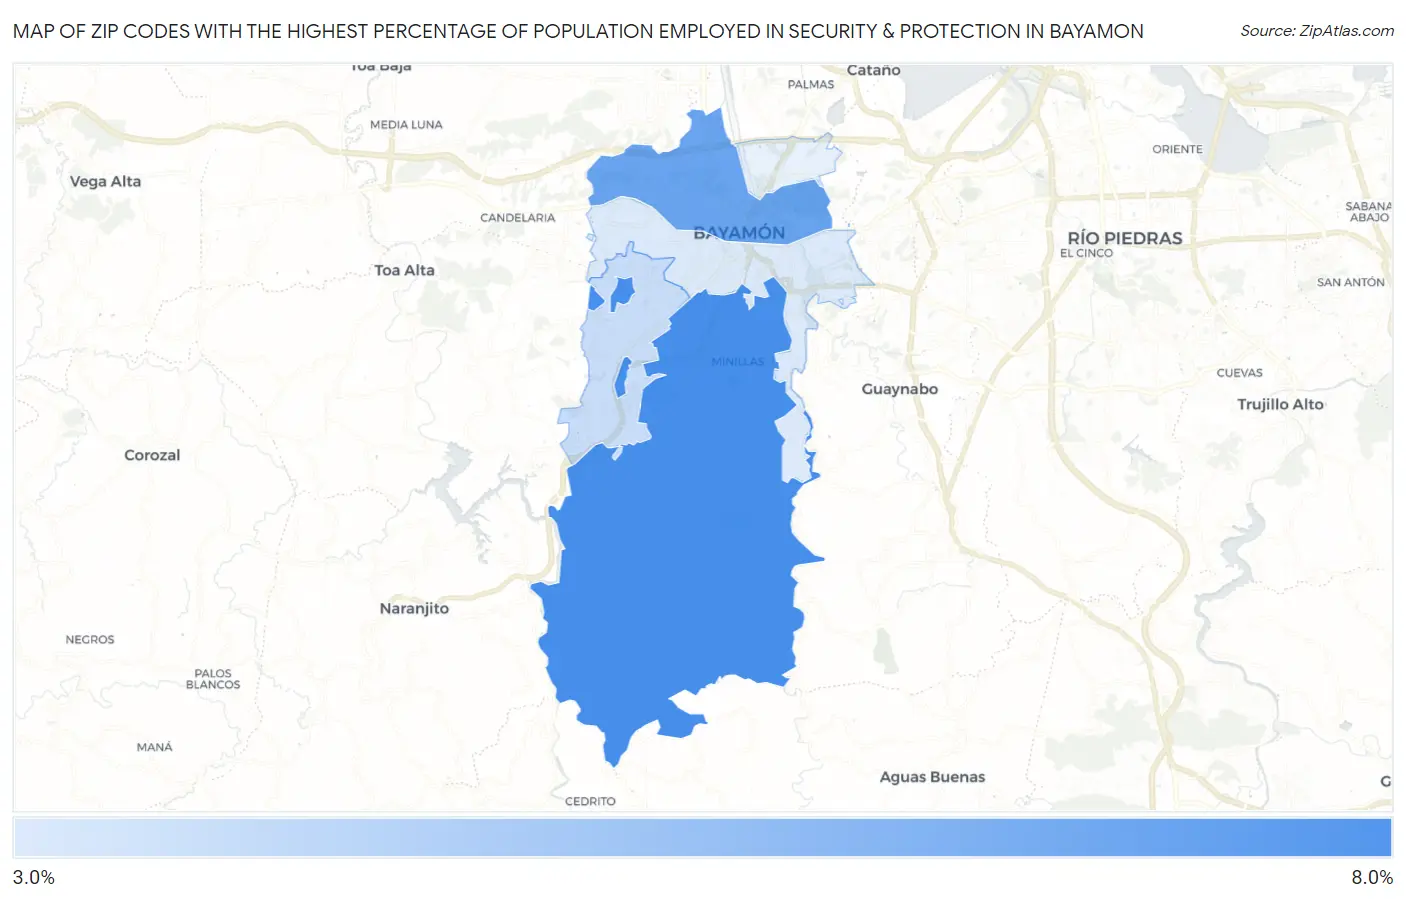
Map of Zip Codes with the Highest Percentage of Population Employed in Security & Protection in Bayamon
0.0%
8.0%
Zip Codes with the Highest Percentage of Population Employed in Security & Protection in Bayamon, PR
| Zip Code | % Employed | vs State | vs National | |
| 1. | 00956 | 6.2% | 4.9%(+1.24)#40 | 2.1%(+4.03)#1,963 |
| 2. | 00961 | 5.6% | 4.9%(+0.642)#50 | 2.1%(+3.43)#2,382 |
| 3. | 00957 | 3.9% | 4.9%(-1.00)#77 | 2.1%(+1.79)#4,612 |
| 4. | 00959 | 3.6% | 4.9%(-1.35)#90 | 2.1%(+1.44)#5,434 |
1
Common Questions
What are the Top 3 Zip Codes with the Highest Percentage of Population Employed in Security & Protection in Bayamon, PR?
Top 3 Zip Codes with the Highest Percentage of Population Employed in Security & Protection in Bayamon, PR are:
What zip code has the Highest Percentage of Population Employed in Security & Protection in Bayamon, PR?
00956 has the Highest Percentage of Population Employed in Security & Protection in Bayamon, PR with 6.2%.
What is the Percentage of Population Employed in Security & Protection in Bayamon, PR?
Percentage of Population Employed in Security & Protection in Bayamon is 9.6%.
What is the Percentage of Population Employed in Security & Protection in Puerto Rico?
Percentage of Population Employed in Security & Protection in Puerto Rico is 4.9%.
What is the Percentage of Population Employed in Security & Protection in the United States?
Percentage of Population Employed in Security & Protection in the United States is 2.1%.