Ute vs Immigrants from Italy Poverty
COMPARE
Ute
Immigrants from Italy
Poverty
Poverty Comparison
Ute
Immigrants from Italy
16.9%
POVERTY
0.0/ 100
METRIC RATING
328th/ 347
METRIC RANK
11.2%
POVERTY
97.9/ 100
METRIC RATING
61st/ 347
METRIC RANK
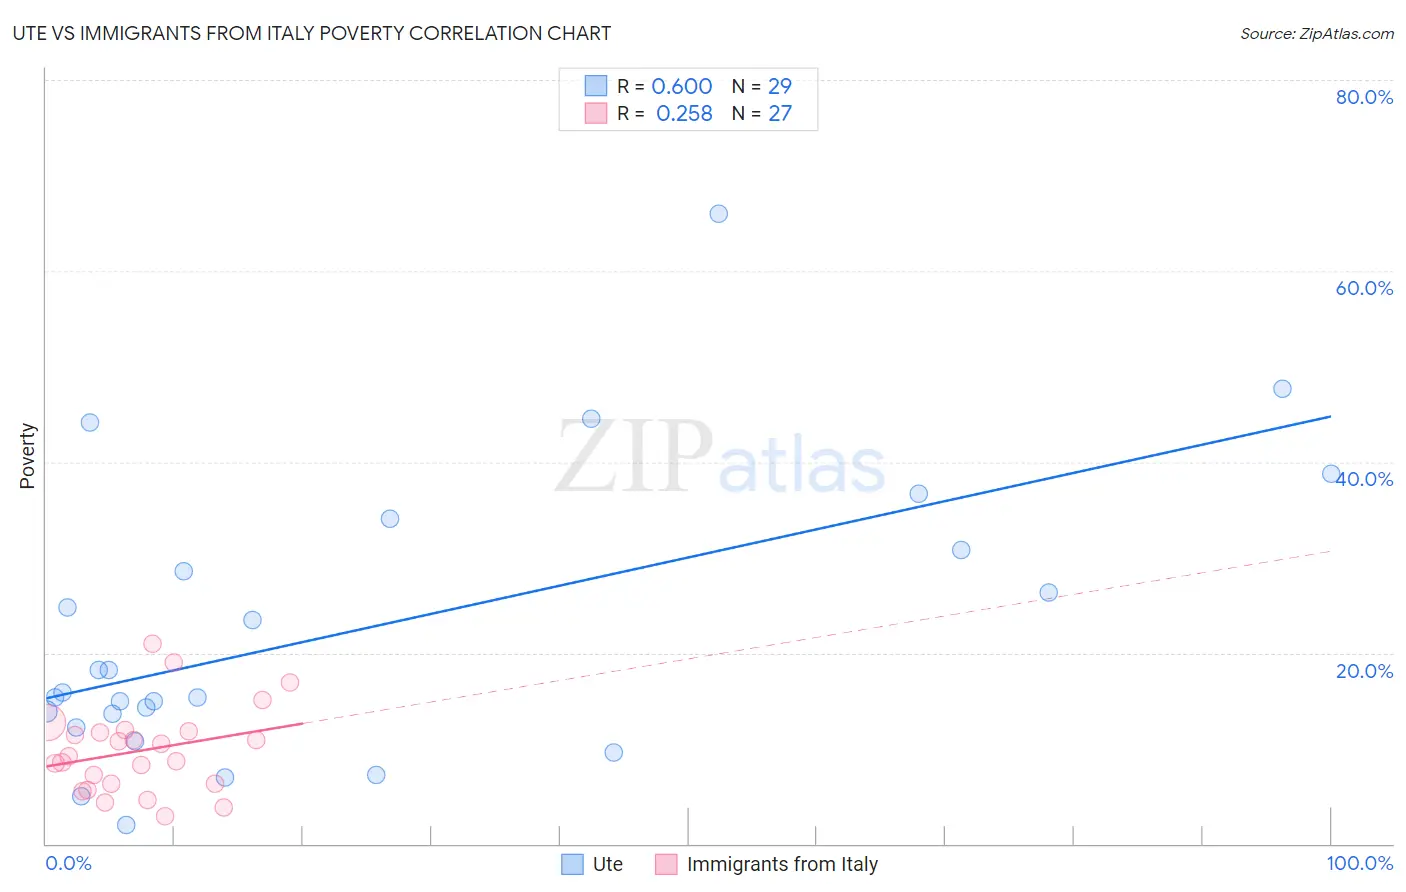
Ute vs Immigrants from Italy Poverty Correlation Chart
The statistical analysis conducted on geographies consisting of 55,667,697 people shows a significant positive correlation between the proportion of Ute and poverty level in the United States with a correlation coefficient (R) of 0.600 and weighted average of 16.9%. Similarly, the statistical analysis conducted on geographies consisting of 324,121,527 people shows a weak positive correlation between the proportion of Immigrants from Italy and poverty level in the United States with a correlation coefficient (R) of 0.258 and weighted average of 11.2%, a difference of 51.3%.
Poverty Correlation Summary
| Measurement | Ute | Immigrants from Italy |
| Minimum | 2.0% | 2.9% |
| Maximum | 66.0% | 21.0% |
| Range | 64.0% | 18.1% |
| Mean | 22.6% | 9.8% |
| Median | 15.9% | 9.2% |
| Interquartile 25% (IQ1) | 12.9% | 6.2% |
| Interquartile 75% (IQ3) | 32.4% | 11.8% |
| Interquartile Range (IQR) | 19.5% | 5.5% |
| Standard Deviation (Sample) | 15.0% | 4.5% |
| Standard Deviation (Population) | 14.8% | 4.4% |
Similar Demographics by Poverty
Demographics Similar to Ute by Poverty
In terms of poverty, the demographic groups most similar to Ute are Kiowa (16.8%, a difference of 0.43%), Paiute (16.7%, a difference of 0.96%), Central American Indian (16.7%, a difference of 1.3%), Yakama (16.7%, a difference of 1.5%), and Colville (16.6%, a difference of 2.0%).
| Demographics | Rating | Rank | Poverty |
| Arapaho | 0.0 /100 | #321 | Tragic 16.3% |
| Menominee | 0.0 /100 | #322 | Tragic 16.4% |
| Colville | 0.0 /100 | #323 | Tragic 16.6% |
| Yakama | 0.0 /100 | #324 | Tragic 16.7% |
| Central American Indians | 0.0 /100 | #325 | Tragic 16.7% |
| Paiute | 0.0 /100 | #326 | Tragic 16.7% |
| Kiowa | 0.0 /100 | #327 | Tragic 16.8% |
| Ute | 0.0 /100 | #328 | Tragic 16.9% |
| Blacks/African Americans | 0.0 /100 | #329 | Tragic 17.3% |
| Dominicans | 0.0 /100 | #330 | Tragic 17.6% |
| Immigrants | Dominican Republic | 0.0 /100 | #331 | Tragic 17.8% |
| Natives/Alaskans | 0.0 /100 | #332 | Tragic 18.1% |
| Houma | 0.0 /100 | #333 | Tragic 18.4% |
| Apache | 0.0 /100 | #334 | Tragic 18.4% |
| Cheyenne | 0.0 /100 | #335 | Tragic 18.9% |
Demographics Similar to Immigrants from Italy by Poverty
In terms of poverty, the demographic groups most similar to Immigrants from Italy are Austrian (11.2%, a difference of 0.030%), Ukrainian (11.2%, a difference of 0.040%), Immigrants from Sri Lanka (11.2%, a difference of 0.060%), Immigrants from Europe (11.2%, a difference of 0.22%), and Swiss (11.2%, a difference of 0.25%).
| Demographics | Rating | Rank | Poverty |
| Immigrants | Bulgaria | 98.5 /100 | #54 | Exceptional 11.1% |
| Immigrants | Serbia | 98.5 /100 | #55 | Exceptional 11.1% |
| Estonians | 98.2 /100 | #56 | Exceptional 11.1% |
| Scandinavians | 98.2 /100 | #57 | Exceptional 11.1% |
| Germans | 98.1 /100 | #58 | Exceptional 11.1% |
| Immigrants | Europe | 98.0 /100 | #59 | Exceptional 11.2% |
| Immigrants | Sri Lanka | 97.9 /100 | #60 | Exceptional 11.2% |
| Immigrants | Italy | 97.9 /100 | #61 | Exceptional 11.2% |
| Austrians | 97.8 /100 | #62 | Exceptional 11.2% |
| Ukrainians | 97.8 /100 | #63 | Exceptional 11.2% |
| Swiss | 97.7 /100 | #64 | Exceptional 11.2% |
| Immigrants | Asia | 97.5 /100 | #65 | Exceptional 11.2% |
| Immigrants | Netherlands | 97.5 /100 | #66 | Exceptional 11.2% |
| Immigrants | Australia | 97.4 /100 | #67 | Exceptional 11.2% |
| Slovaks | 97.4 /100 | #68 | Exceptional 11.2% |