Immigrants from Barbados vs Immigrants from Italy Poverty
COMPARE
Immigrants from Barbados
Immigrants from Italy
Poverty
Poverty Comparison
Immigrants from Barbados
Immigrants from Italy
14.9%
POVERTY
0.0/ 100
METRIC RATING
281st/ 347
METRIC RANK
11.2%
POVERTY
97.9/ 100
METRIC RATING
61st/ 347
METRIC RANK
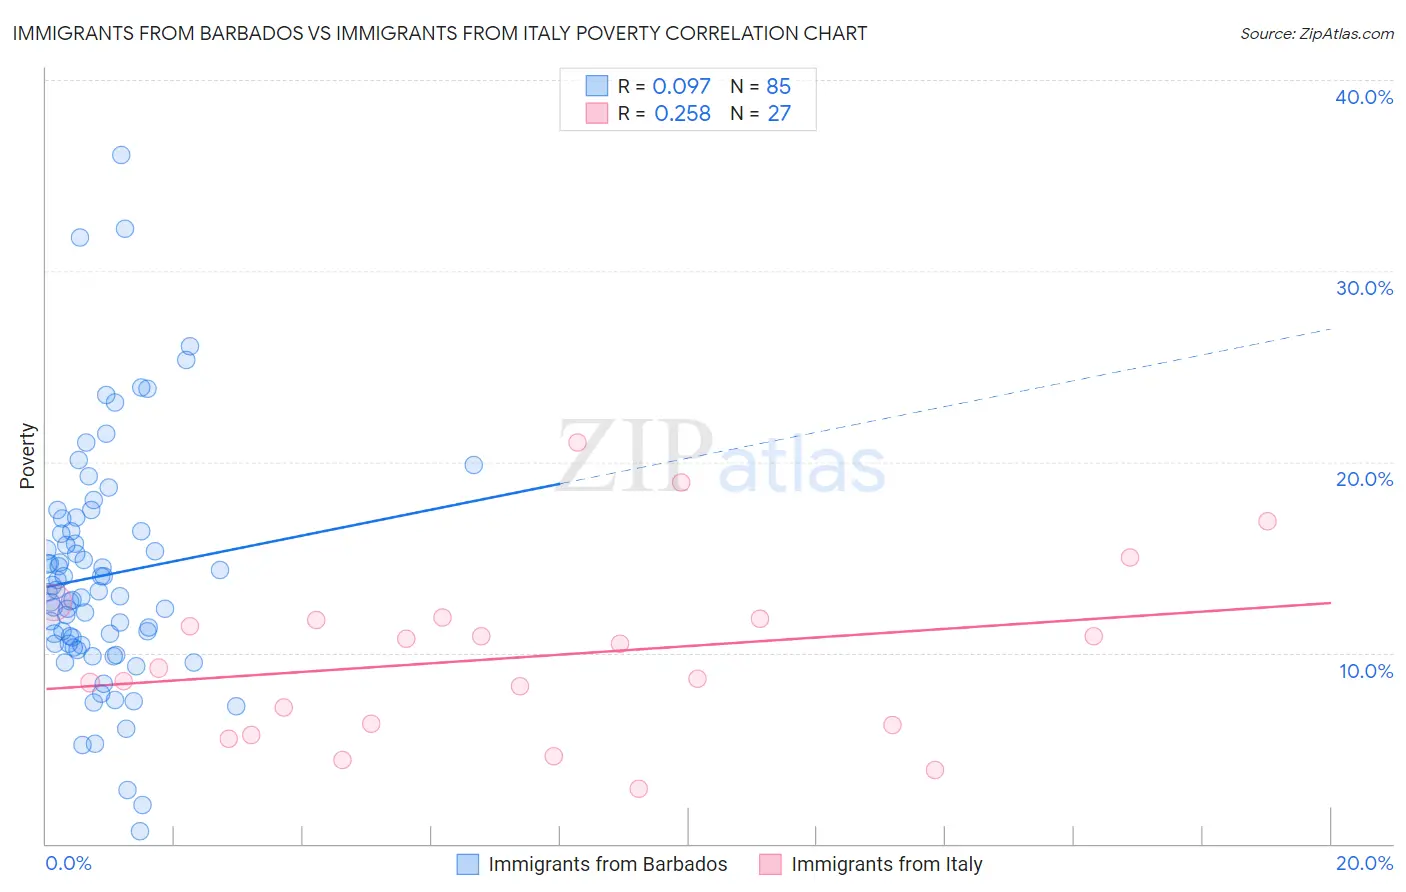
Immigrants from Barbados vs Immigrants from Italy Poverty Correlation Chart
The statistical analysis conducted on geographies consisting of 112,771,584 people shows a slight positive correlation between the proportion of Immigrants from Barbados and poverty level in the United States with a correlation coefficient (R) of 0.097 and weighted average of 14.9%. Similarly, the statistical analysis conducted on geographies consisting of 324,121,527 people shows a weak positive correlation between the proportion of Immigrants from Italy and poverty level in the United States with a correlation coefficient (R) of 0.258 and weighted average of 11.2%, a difference of 33.4%.
Poverty Correlation Summary
| Measurement | Immigrants from Barbados | Immigrants from Italy |
| Minimum | 0.68% | 2.9% |
| Maximum | 36.1% | 21.0% |
| Range | 35.4% | 18.1% |
| Mean | 14.0% | 9.8% |
| Median | 13.2% | 9.2% |
| Interquartile 25% (IQ1) | 10.4% | 6.2% |
| Interquartile 75% (IQ3) | 16.4% | 11.8% |
| Interquartile Range (IQR) | 6.0% | 5.5% |
| Standard Deviation (Sample) | 6.2% | 4.5% |
| Standard Deviation (Population) | 6.2% | 4.4% |
Similar Demographics by Poverty
Demographics Similar to Immigrants from Barbados by Poverty
In terms of poverty, the demographic groups most similar to Immigrants from Barbados are Haitian (14.9%, a difference of 0.070%), Immigrants from St. Vincent and the Grenadines (14.9%, a difference of 0.27%), Comanche (15.0%, a difference of 0.33%), Immigrants from Haiti (15.0%, a difference of 0.45%), and West Indian (15.0%, a difference of 0.55%).
| Demographics | Rating | Rank | Poverty |
| Barbadians | 0.0 /100 | #274 | Tragic 14.8% |
| Immigrants | West Indies | 0.0 /100 | #275 | Tragic 14.8% |
| Immigrants | Bahamas | 0.0 /100 | #276 | Tragic 14.8% |
| Bangladeshis | 0.0 /100 | #277 | Tragic 14.8% |
| Belizeans | 0.0 /100 | #278 | Tragic 14.8% |
| Immigrants | St. Vincent and the Grenadines | 0.0 /100 | #279 | Tragic 14.9% |
| Haitians | 0.0 /100 | #280 | Tragic 14.9% |
| Immigrants | Barbados | 0.0 /100 | #281 | Tragic 14.9% |
| Comanche | 0.0 /100 | #282 | Tragic 15.0% |
| Immigrants | Haiti | 0.0 /100 | #283 | Tragic 15.0% |
| West Indians | 0.0 /100 | #284 | Tragic 15.0% |
| Vietnamese | 0.0 /100 | #285 | Tragic 15.0% |
| Immigrants | Latin America | 0.0 /100 | #286 | Tragic 15.0% |
| Inupiat | 0.0 /100 | #287 | Tragic 15.1% |
| Yaqui | 0.0 /100 | #288 | Tragic 15.1% |
Demographics Similar to Immigrants from Italy by Poverty
In terms of poverty, the demographic groups most similar to Immigrants from Italy are Austrian (11.2%, a difference of 0.030%), Ukrainian (11.2%, a difference of 0.040%), Immigrants from Sri Lanka (11.2%, a difference of 0.060%), Immigrants from Europe (11.2%, a difference of 0.22%), and Swiss (11.2%, a difference of 0.25%).
| Demographics | Rating | Rank | Poverty |
| Immigrants | Bulgaria | 98.5 /100 | #54 | Exceptional 11.1% |
| Immigrants | Serbia | 98.5 /100 | #55 | Exceptional 11.1% |
| Estonians | 98.2 /100 | #56 | Exceptional 11.1% |
| Scandinavians | 98.2 /100 | #57 | Exceptional 11.1% |
| Germans | 98.1 /100 | #58 | Exceptional 11.1% |
| Immigrants | Europe | 98.0 /100 | #59 | Exceptional 11.2% |
| Immigrants | Sri Lanka | 97.9 /100 | #60 | Exceptional 11.2% |
| Immigrants | Italy | 97.9 /100 | #61 | Exceptional 11.2% |
| Austrians | 97.8 /100 | #62 | Exceptional 11.2% |
| Ukrainians | 97.8 /100 | #63 | Exceptional 11.2% |
| Swiss | 97.7 /100 | #64 | Exceptional 11.2% |
| Immigrants | Asia | 97.5 /100 | #65 | Exceptional 11.2% |
| Immigrants | Netherlands | 97.5 /100 | #66 | Exceptional 11.2% |
| Immigrants | Australia | 97.4 /100 | #67 | Exceptional 11.2% |
| Slovaks | 97.4 /100 | #68 | Exceptional 11.2% |