Ute vs Immigrants from Austria Single Female Poverty
COMPARE
Ute
Immigrants from Austria
Single Female Poverty
Single Female Poverty Comparison
Ute
Immigrants from Austria
28.4%
SINGLE FEMALE POVERTY
0.0/ 100
METRIC RATING
333rd/ 347
METRIC RANK
19.6%
SINGLE FEMALE POVERTY
98.8/ 100
METRIC RATING
93rd/ 347
METRIC RANK
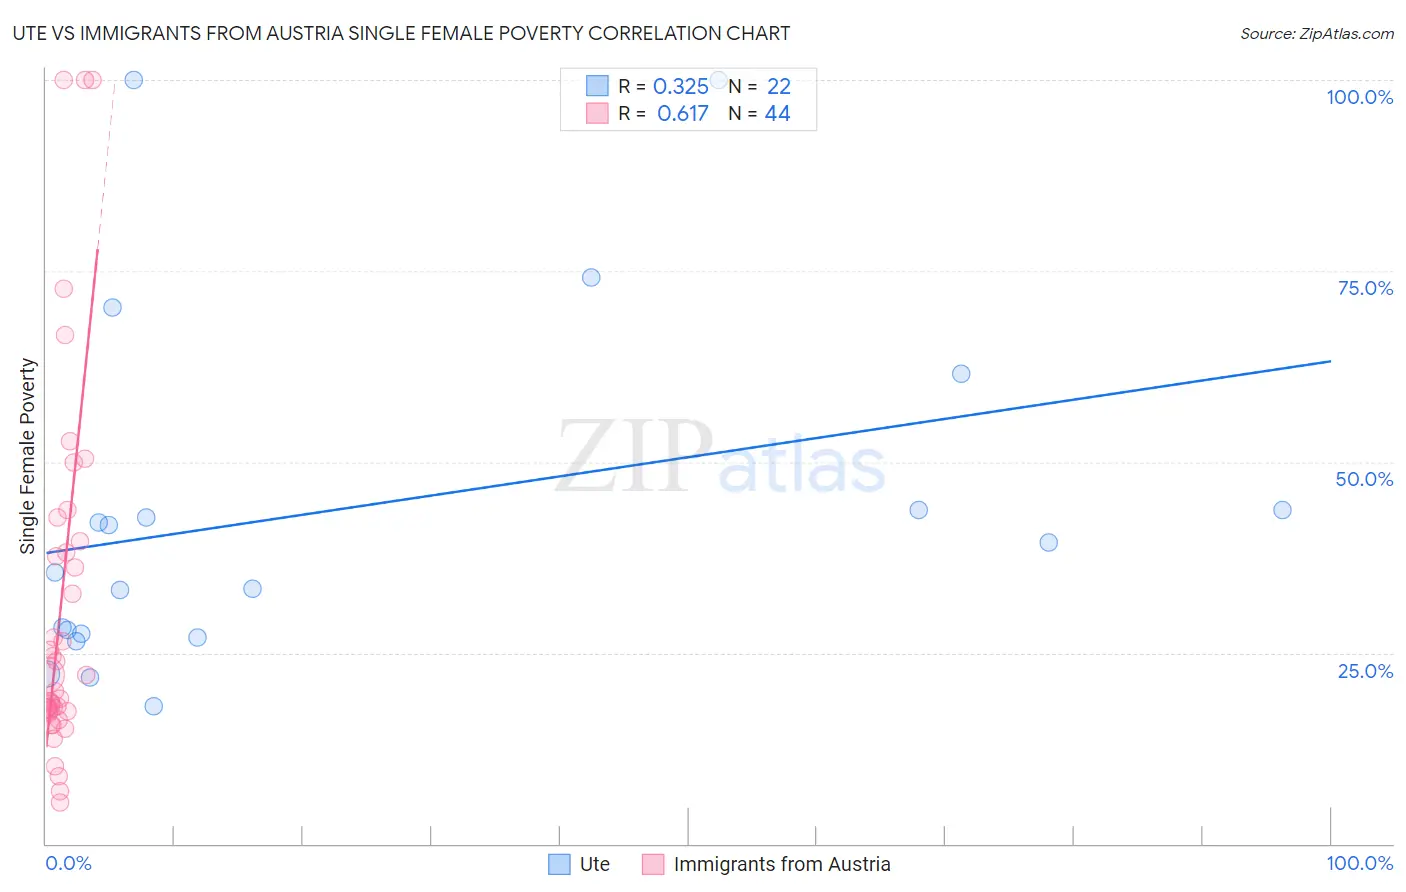
Ute vs Immigrants from Austria Single Female Poverty Correlation Chart
The statistical analysis conducted on geographies consisting of 55,519,789 people shows a mild positive correlation between the proportion of Ute and poverty level among single females in the United States with a correlation coefficient (R) of 0.325 and weighted average of 28.4%. Similarly, the statistical analysis conducted on geographies consisting of 166,235,913 people shows a significant positive correlation between the proportion of Immigrants from Austria and poverty level among single females in the United States with a correlation coefficient (R) of 0.617 and weighted average of 19.6%, a difference of 45.1%.
Single Female Poverty Correlation Summary
| Measurement | Ute | Immigrants from Austria |
| Minimum | 18.0% | 5.5% |
| Maximum | 100.0% | 100.0% |
| Range | 82.0% | 94.5% |
| Mean | 43.7% | 31.3% |
| Median | 37.5% | 21.0% |
| Interquartile 25% (IQ1) | 27.4% | 17.4% |
| Interquartile 75% (IQ3) | 43.8% | 38.9% |
| Interquartile Range (IQR) | 16.3% | 21.4% |
| Standard Deviation (Sample) | 23.4% | 24.1% |
| Standard Deviation (Population) | 22.9% | 23.8% |
Similar Demographics by Single Female Poverty
Demographics Similar to Ute by Single Female Poverty
In terms of single female poverty, the demographic groups most similar to Ute are Yakama (28.3%, a difference of 0.42%), Native/Alaskan (28.2%, a difference of 0.68%), Pueblo (28.6%, a difference of 0.73%), Hopi (28.0%, a difference of 1.3%), and Immigrants from Yemen (28.9%, a difference of 1.9%).
| Demographics | Rating | Rank | Single Female Poverty |
| Creek | 0.0 /100 | #326 | Tragic 27.4% |
| Dutch West Indians | 0.0 /100 | #327 | Tragic 27.5% |
| Apache | 0.0 /100 | #328 | Tragic 27.7% |
| Menominee | 0.0 /100 | #329 | Tragic 27.8% |
| Hopi | 0.0 /100 | #330 | Tragic 28.0% |
| Natives/Alaskans | 0.0 /100 | #331 | Tragic 28.2% |
| Yakama | 0.0 /100 | #332 | Tragic 28.3% |
| Ute | 0.0 /100 | #333 | Tragic 28.4% |
| Pueblo | 0.0 /100 | #334 | Tragic 28.6% |
| Immigrants | Yemen | 0.0 /100 | #335 | Tragic 28.9% |
| Colville | 0.0 /100 | #336 | Tragic 29.1% |
| Yuman | 0.0 /100 | #337 | Tragic 29.4% |
| Pima | 0.0 /100 | #338 | Tragic 30.3% |
| Cheyenne | 0.0 /100 | #339 | Tragic 30.4% |
| Cajuns | 0.0 /100 | #340 | Tragic 30.6% |
Demographics Similar to Immigrants from Austria by Single Female Poverty
In terms of single female poverty, the demographic groups most similar to Immigrants from Austria are Italian (19.6%, a difference of 0.010%), Soviet Union (19.6%, a difference of 0.060%), Immigrants from Lebanon (19.6%, a difference of 0.12%), Romanian (19.6%, a difference of 0.22%), and Immigrants from Ukraine (19.5%, a difference of 0.30%).
| Demographics | Rating | Rank | Single Female Poverty |
| Greeks | 99.2 /100 | #86 | Exceptional 19.4% |
| Zimbabweans | 99.0 /100 | #87 | Exceptional 19.5% |
| Afghans | 99.0 /100 | #88 | Exceptional 19.5% |
| Immigrants | Ukraine | 99.0 /100 | #89 | Exceptional 19.5% |
| Immigrants | Lebanon | 98.8 /100 | #90 | Exceptional 19.6% |
| Soviet Union | 98.8 /100 | #91 | Exceptional 19.6% |
| Italians | 98.8 /100 | #92 | Exceptional 19.6% |
| Immigrants | Austria | 98.8 /100 | #93 | Exceptional 19.6% |
| Romanians | 98.6 /100 | #94 | Exceptional 19.6% |
| Estonians | 98.2 /100 | #95 | Exceptional 19.7% |
| Immigrants | Brazil | 98.2 /100 | #96 | Exceptional 19.7% |
| Croatians | 98.1 /100 | #97 | Exceptional 19.7% |
| Immigrants | France | 97.9 /100 | #98 | Exceptional 19.7% |
| Sierra Leoneans | 97.9 /100 | #99 | Exceptional 19.7% |
| Ukrainians | 97.6 /100 | #100 | Exceptional 19.8% |