Sri Lankan vs Pima Seniors Poverty Over the Age of 75
COMPARE
Sri Lankan
Pima
Seniors Poverty Over the Age of 75
Seniors Poverty Over the Age of 75 Comparison
Sri Lankans
Pima
12.4%
SENIORS POVERTY OVER THE AGE OF 75
32.3/ 100
METRIC RATING
186th/ 347
METRIC RANK
23.9%
SENIORS POVERTY OVER THE AGE OF 75
0.0/ 100
METRIC RATING
347th/ 347
METRIC RANK
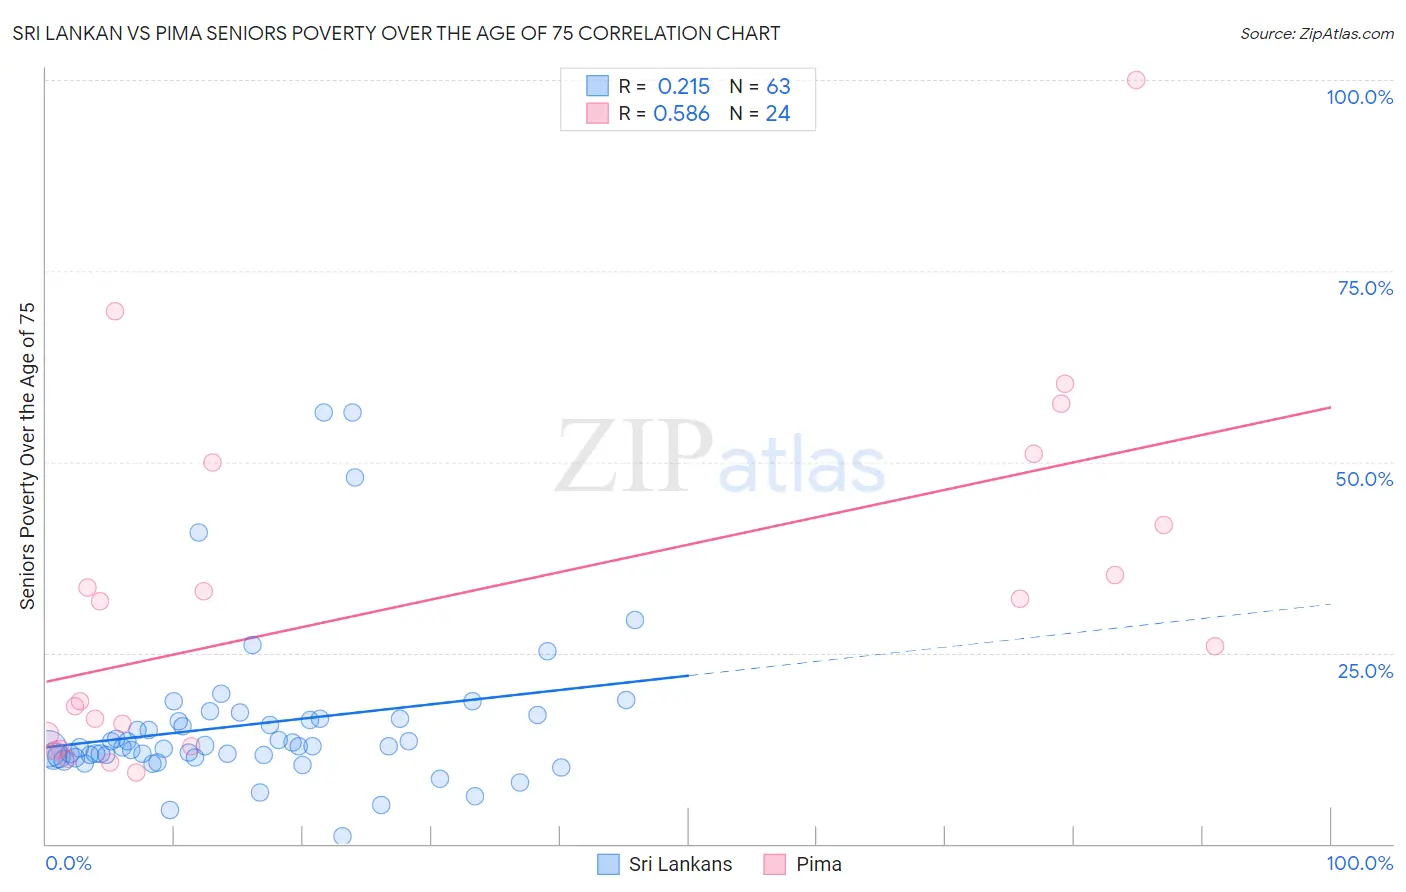
Sri Lankan vs Pima Seniors Poverty Over the Age of 75 Correlation Chart
The statistical analysis conducted on geographies consisting of 434,587,181 people shows a weak positive correlation between the proportion of Sri Lankans and poverty level among seniors over the age of 75 in the United States with a correlation coefficient (R) of 0.215 and weighted average of 12.4%. Similarly, the statistical analysis conducted on geographies consisting of 61,445,536 people shows a substantial positive correlation between the proportion of Pima and poverty level among seniors over the age of 75 in the United States with a correlation coefficient (R) of 0.586 and weighted average of 23.9%, a difference of 93.0%.
Seniors Poverty Over the Age of 75 Correlation Summary
| Measurement | Sri Lankan | Pima |
| Minimum | 1.0% | 9.4% |
| Maximum | 56.5% | 100.0% |
| Range | 55.5% | 90.6% |
| Mean | 15.6% | 32.2% |
| Median | 12.7% | 28.8% |
| Interquartile 25% (IQ1) | 11.4% | 13.6% |
| Interquartile 75% (IQ3) | 16.4% | 45.8% |
| Interquartile Range (IQR) | 5.0% | 32.3% |
| Standard Deviation (Sample) | 10.4% | 22.9% |
| Standard Deviation (Population) | 10.3% | 22.4% |
Similar Demographics by Seniors Poverty Over the Age of 75
Demographics Similar to Sri Lankans by Seniors Poverty Over the Age of 75
In terms of seniors poverty over the age of 75, the demographic groups most similar to Sri Lankans are Immigrants from Malaysia (12.3%, a difference of 0.31%), Kiowa (12.3%, a difference of 0.32%), Laotian (12.3%, a difference of 0.52%), Yaqui (12.5%, a difference of 0.63%), and Immigrants from Northern Africa (12.5%, a difference of 0.70%).
| Demographics | Rating | Rank | Seniors Poverty Over the Age of 75 |
| Mongolians | 45.5 /100 | #179 | Average 12.2% |
| Immigrants | South Eastern Asia | 44.3 /100 | #180 | Average 12.2% |
| Immigrants | Australia | 44.2 /100 | #181 | Average 12.2% |
| German Russians | 41.4 /100 | #182 | Average 12.3% |
| Laotians | 38.2 /100 | #183 | Fair 12.3% |
| Kiowa | 36.0 /100 | #184 | Fair 12.3% |
| Immigrants | Malaysia | 35.8 /100 | #185 | Fair 12.3% |
| Sri Lankans | 32.3 /100 | #186 | Fair 12.4% |
| Yaqui | 25.9 /100 | #187 | Fair 12.5% |
| Immigrants | Northern Africa | 25.2 /100 | #188 | Fair 12.5% |
| Immigrants | Indonesia | 24.4 /100 | #189 | Fair 12.5% |
| Immigrants | Congo | 23.9 /100 | #190 | Fair 12.5% |
| Liberians | 23.2 /100 | #191 | Fair 12.5% |
| Choctaw | 20.2 /100 | #192 | Fair 12.5% |
| Taiwanese | 17.8 /100 | #193 | Poor 12.6% |
Demographics Similar to Pima by Seniors Poverty Over the Age of 75
In terms of seniors poverty over the age of 75, the demographic groups most similar to Pima are Puerto Rican (23.2%, a difference of 2.9%), Immigrants from Dominican Republic (20.1%, a difference of 19.1%), Immigrants from Cuba (19.9%, a difference of 20.0%), Lumbee (19.7%, a difference of 20.9%), and Dominican (19.6%, a difference of 21.7%).
| Demographics | Rating | Rank | Seniors Poverty Over the Age of 75 |
| Immigrants | Nicaragua | 0.0 /100 | #333 | Tragic 17.6% |
| Immigrants | Grenada | 0.0 /100 | #334 | Tragic 17.8% |
| Cubans | 0.0 /100 | #335 | Tragic 18.0% |
| Immigrants | Caribbean | 0.0 /100 | #336 | Tragic 18.2% |
| Yakama | 0.0 /100 | #337 | Tragic 18.3% |
| Immigrants | Cabo Verde | 0.0 /100 | #338 | Tragic 18.5% |
| Hopi | 0.0 /100 | #339 | Tragic 18.9% |
| Tohono O'odham | 0.0 /100 | #340 | Tragic 19.1% |
| Navajo | 0.0 /100 | #341 | Tragic 19.4% |
| Dominicans | 0.0 /100 | #342 | Tragic 19.6% |
| Lumbee | 0.0 /100 | #343 | Tragic 19.7% |
| Immigrants | Cuba | 0.0 /100 | #344 | Tragic 19.9% |
| Immigrants | Dominican Republic | 0.0 /100 | #345 | Tragic 20.1% |
| Puerto Ricans | 0.0 /100 | #346 | Tragic 23.2% |
| Pima | 0.0 /100 | #347 | Tragic 23.9% |