Pueblo vs Immigrants from North America Single Female Poverty
COMPARE
Pueblo
Immigrants from North America
Single Female Poverty
Single Female Poverty Comparison
Pueblo
Immigrants from North America
28.6%
SINGLE FEMALE POVERTY
0.0/ 100
METRIC RATING
334th/ 347
METRIC RANK
20.3%
SINGLE FEMALE POVERTY
89.5/ 100
METRIC RATING
141st/ 347
METRIC RANK
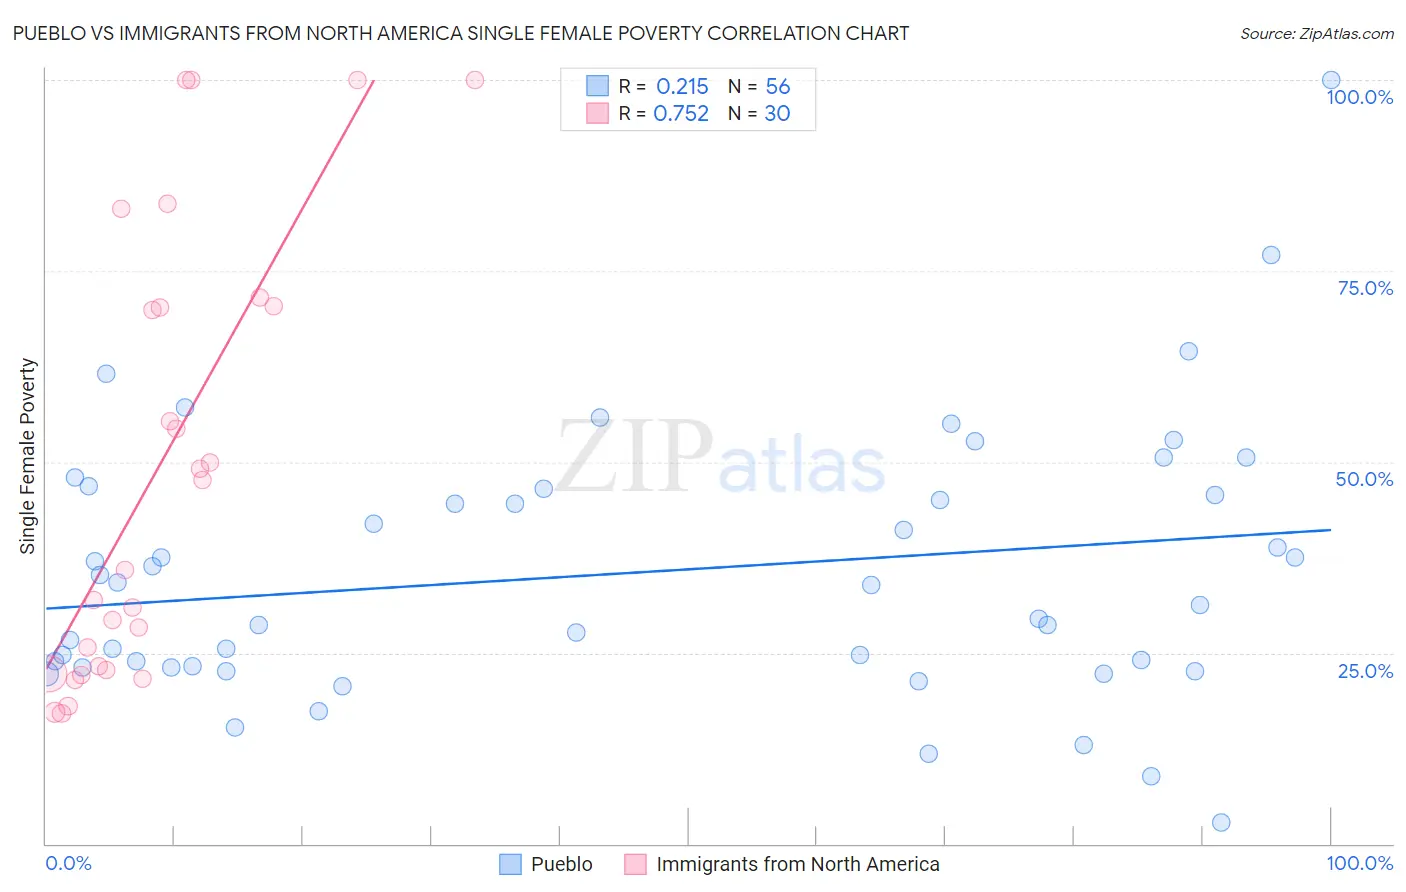
Pueblo vs Immigrants from North America Single Female Poverty Correlation Chart
The statistical analysis conducted on geographies consisting of 119,546,041 people shows a weak positive correlation between the proportion of Pueblo and poverty level among single females in the United States with a correlation coefficient (R) of 0.215 and weighted average of 28.6%. Similarly, the statistical analysis conducted on geographies consisting of 451,673,972 people shows a strong positive correlation between the proportion of Immigrants from North America and poverty level among single females in the United States with a correlation coefficient (R) of 0.752 and weighted average of 20.3%, a difference of 40.9%.
Single Female Poverty Correlation Summary
| Measurement | Pueblo | Immigrants from North America |
| Minimum | 2.9% | 17.0% |
| Maximum | 100.0% | 100.0% |
| Range | 97.1% | 83.0% |
| Mean | 35.5% | 49.1% |
| Median | 32.6% | 41.8% |
| Interquartile 25% (IQ1) | 23.2% | 22.7% |
| Interquartile 75% (IQ3) | 46.1% | 70.4% |
| Interquartile Range (IQR) | 22.9% | 47.6% |
| Standard Deviation (Sample) | 17.5% | 28.9% |
| Standard Deviation (Population) | 17.4% | 28.4% |
Similar Demographics by Single Female Poverty
Demographics Similar to Pueblo by Single Female Poverty
In terms of single female poverty, the demographic groups most similar to Pueblo are Ute (28.4%, a difference of 0.73%), Immigrants from Yemen (28.9%, a difference of 1.1%), Yakama (28.3%, a difference of 1.1%), Native/Alaskan (28.2%, a difference of 1.4%), and Colville (29.1%, a difference of 1.6%).
| Demographics | Rating | Rank | Single Female Poverty |
| Dutch West Indians | 0.0 /100 | #327 | Tragic 27.5% |
| Apache | 0.0 /100 | #328 | Tragic 27.7% |
| Menominee | 0.0 /100 | #329 | Tragic 27.8% |
| Hopi | 0.0 /100 | #330 | Tragic 28.0% |
| Natives/Alaskans | 0.0 /100 | #331 | Tragic 28.2% |
| Yakama | 0.0 /100 | #332 | Tragic 28.3% |
| Ute | 0.0 /100 | #333 | Tragic 28.4% |
| Pueblo | 0.0 /100 | #334 | Tragic 28.6% |
| Immigrants | Yemen | 0.0 /100 | #335 | Tragic 28.9% |
| Colville | 0.0 /100 | #336 | Tragic 29.1% |
| Yuman | 0.0 /100 | #337 | Tragic 29.4% |
| Pima | 0.0 /100 | #338 | Tragic 30.3% |
| Cheyenne | 0.0 /100 | #339 | Tragic 30.4% |
| Cajuns | 0.0 /100 | #340 | Tragic 30.6% |
| Sioux | 0.0 /100 | #341 | Tragic 31.3% |
Demographics Similar to Immigrants from North America by Single Female Poverty
In terms of single female poverty, the demographic groups most similar to Immigrants from North America are Immigrants from Uganda (20.3%, a difference of 0.080%), Syrian (20.3%, a difference of 0.15%), Slovene (20.3%, a difference of 0.16%), Immigrants from Kuwait (20.3%, a difference of 0.16%), and Australian (20.3%, a difference of 0.19%).
| Demographics | Rating | Rank | Single Female Poverty |
| Immigrants | Venezuela | 91.5 /100 | #134 | Exceptional 20.2% |
| Immigrants | Iraq | 91.2 /100 | #135 | Exceptional 20.2% |
| Immigrants | Canada | 91.2 /100 | #136 | Exceptional 20.2% |
| Immigrants | Nepal | 90.6 /100 | #137 | Exceptional 20.3% |
| Slovenes | 90.5 /100 | #138 | Exceptional 20.3% |
| Immigrants | Kuwait | 90.4 /100 | #139 | Exceptional 20.3% |
| Syrians | 90.4 /100 | #140 | Exceptional 20.3% |
| Immigrants | North America | 89.5 /100 | #141 | Excellent 20.3% |
| Immigrants | Uganda | 89.1 /100 | #142 | Excellent 20.3% |
| Australians | 88.4 /100 | #143 | Excellent 20.3% |
| Immigrants | Uzbekistan | 88.3 /100 | #144 | Excellent 20.3% |
| Austrians | 85.8 /100 | #145 | Excellent 20.4% |
| Venezuelans | 85.5 /100 | #146 | Excellent 20.4% |
| South Africans | 85.3 /100 | #147 | Excellent 20.4% |
| Luxembourgers | 84.9 /100 | #148 | Excellent 20.4% |