Potawatomi vs Immigrants from Burma/Myanmar Single Father Poverty
COMPARE
Potawatomi
Immigrants from Burma/Myanmar
Single Father Poverty
Single Father Poverty Comparison
Potawatomi
Immigrants from Burma/Myanmar
18.9%
SINGLE FATHER POVERTY
0.0/ 100
METRIC RATING
313th/ 347
METRIC RANK
16.5%
SINGLE FATHER POVERTY
28.0/ 100
METRIC RATING
190th/ 347
METRIC RANK
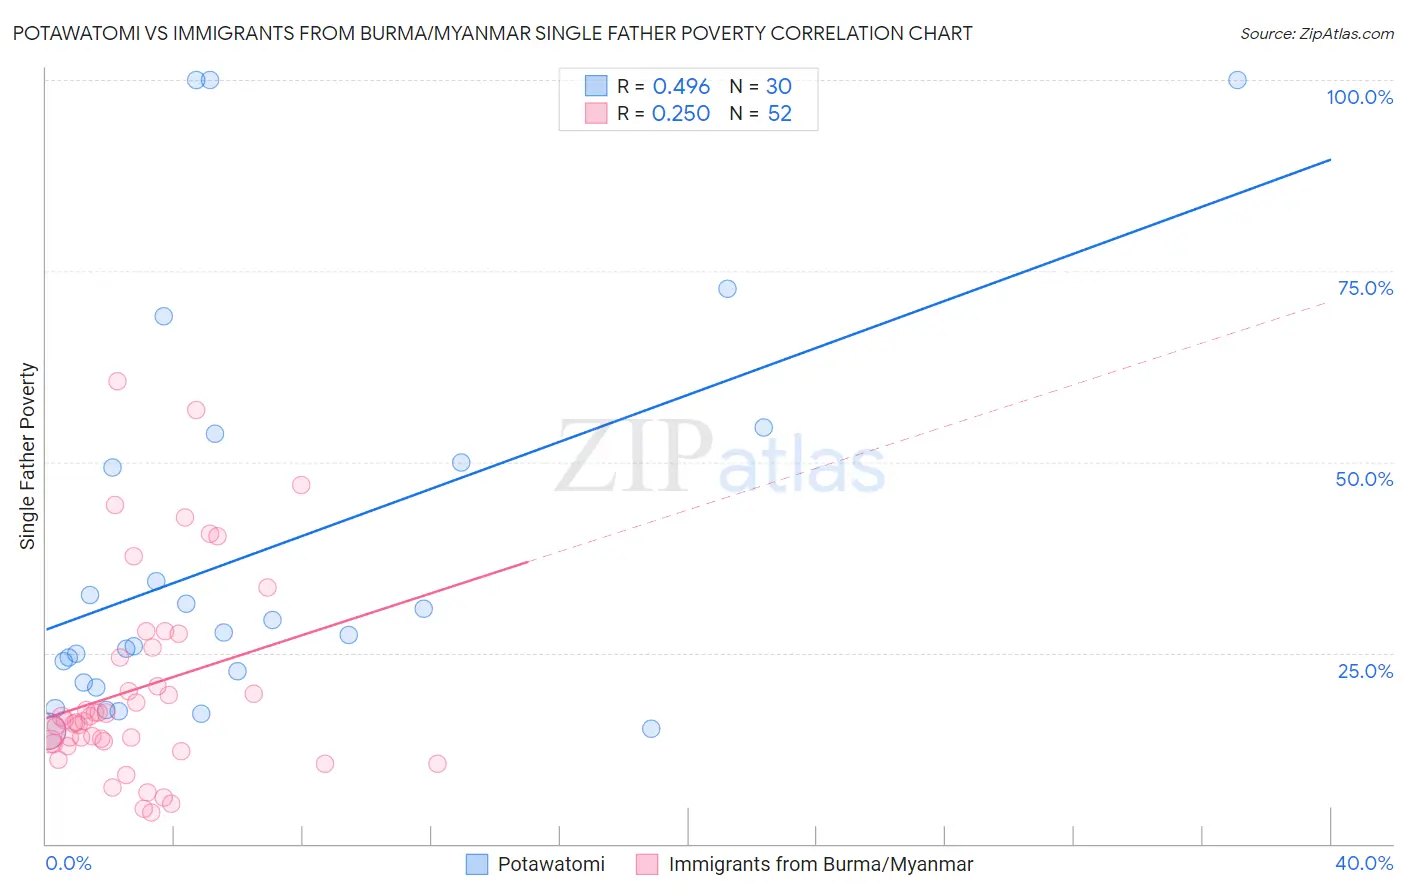
Potawatomi vs Immigrants from Burma/Myanmar Single Father Poverty Correlation Chart
The statistical analysis conducted on geographies consisting of 106,133,326 people shows a moderate positive correlation between the proportion of Potawatomi and poverty level among single fathers in the United States with a correlation coefficient (R) of 0.496 and weighted average of 18.9%. Similarly, the statistical analysis conducted on geographies consisting of 151,197,682 people shows a weak positive correlation between the proportion of Immigrants from Burma/Myanmar and poverty level among single fathers in the United States with a correlation coefficient (R) of 0.250 and weighted average of 16.5%, a difference of 14.7%.
Single Father Poverty Correlation Summary
| Measurement | Potawatomi | Immigrants from Burma/Myanmar |
| Minimum | 14.8% | 4.1% |
| Maximum | 100.0% | 60.6% |
| Range | 85.2% | 56.5% |
| Mean | 38.4% | 20.3% |
| Median | 27.5% | 16.1% |
| Interquartile 25% (IQ1) | 21.1% | 13.3% |
| Interquartile 75% (IQ3) | 50.0% | 25.0% |
| Interquartile Range (IQR) | 28.9% | 11.8% |
| Standard Deviation (Sample) | 25.8% | 13.0% |
| Standard Deviation (Population) | 25.4% | 12.9% |
Similar Demographics by Single Father Poverty
Demographics Similar to Potawatomi by Single Father Poverty
In terms of single father poverty, the demographic groups most similar to Potawatomi are Delaware (18.9%, a difference of 0.16%), Immigrants from Dominica (18.9%, a difference of 0.20%), Nonimmigrants (18.8%, a difference of 0.25%), Chickasaw (19.0%, a difference of 0.32%), and Chippewa (18.8%, a difference of 0.44%).
| Demographics | Rating | Rank | Single Father Poverty |
| Scotch-Irish | 0.0 /100 | #306 | Tragic 18.6% |
| French Canadians | 0.0 /100 | #307 | Tragic 18.6% |
| Ottawa | 0.0 /100 | #308 | Tragic 18.6% |
| Immigrants | Micronesia | 0.0 /100 | #309 | Tragic 18.6% |
| Chippewa | 0.0 /100 | #310 | Tragic 18.8% |
| Immigrants | Nonimmigrants | 0.0 /100 | #311 | Tragic 18.8% |
| Immigrants | Dominica | 0.0 /100 | #312 | Tragic 18.9% |
| Potawatomi | 0.0 /100 | #313 | Tragic 18.9% |
| Delaware | 0.0 /100 | #314 | Tragic 18.9% |
| Chickasaw | 0.0 /100 | #315 | Tragic 19.0% |
| Osage | 0.0 /100 | #316 | Tragic 19.0% |
| Dominicans | 0.0 /100 | #317 | Tragic 19.1% |
| Dutch West Indians | 0.0 /100 | #318 | Tragic 19.2% |
| Slovaks | 0.0 /100 | #319 | Tragic 19.3% |
| Inupiat | 0.0 /100 | #320 | Tragic 19.5% |
Demographics Similar to Immigrants from Burma/Myanmar by Single Father Poverty
In terms of single father poverty, the demographic groups most similar to Immigrants from Burma/Myanmar are Latvian (16.5%, a difference of 0.050%), Immigrants from Guyana (16.5%, a difference of 0.050%), Russian (16.4%, a difference of 0.11%), Ukrainian (16.4%, a difference of 0.12%), and Immigrants from Venezuela (16.4%, a difference of 0.16%).
| Demographics | Rating | Rank | Single Father Poverty |
| Aleuts | 35.3 /100 | #183 | Fair 16.4% |
| Cambodians | 34.6 /100 | #184 | Fair 16.4% |
| Panamanians | 33.6 /100 | #185 | Fair 16.4% |
| Immigrants | Venezuela | 31.0 /100 | #186 | Fair 16.4% |
| Ukrainians | 30.4 /100 | #187 | Fair 16.4% |
| Russians | 30.1 /100 | #188 | Fair 16.4% |
| Latvians | 28.9 /100 | #189 | Fair 16.5% |
| Immigrants | Burma/Myanmar | 28.0 /100 | #190 | Fair 16.5% |
| Immigrants | Guyana | 27.1 /100 | #191 | Fair 16.5% |
| Immigrants | Switzerland | 24.8 /100 | #192 | Fair 16.5% |
| Ecuadorians | 24.5 /100 | #193 | Fair 16.5% |
| Cape Verdeans | 24.4 /100 | #194 | Fair 16.5% |
| Immigrants | Barbados | 24.3 /100 | #195 | Fair 16.5% |
| Immigrants | Canada | 21.9 /100 | #196 | Fair 16.5% |
| Immigrants | Northern Europe | 20.3 /100 | #197 | Fair 16.5% |