Pakistani vs Subsaharan African Receiving Food Stamps

COMPARE

Pakistani
Race
Ancestry
AfghanAfricanAlaska NativeAlaskan AthabascanAlbanianAleutAlsatianAmericanApacheArabArapahoArgentineanArmenianAssyrian/Chaldean/SyriacAustralianAustrianBahamianBangladeshiBarbadianBasqueBelgianBelizeanBermudanBhutaneseBlackfeetBolivianBrazilianBritishBritish West IndianBulgarianBurmeseCajunCambodianCanadianCape VerdeanCarpatho RusynCelticCentral AmericanCentral American IndianCherokeeCheyenneChickasawChileanChineseChippewaChoctawColombianColvilleComancheCosta RicanCreeCreekCroatianCrowCubanCypriotCzechCzechoslovakianDanishDelawareDominicanDutchDutch West IndianEastern EuropeanEcuadorianEgyptianEnglishEstonianEthiopianEuropeanFijianFilipinoFinnishFrenchFrench American IndianFrench CanadianGermanGerman RussianGhanaianGreekGuamanian/ChamorroGuatemalanGuyaneseHaitianHmongHonduranHopiHoumaHungarianIcelanderIndian (Asian)IndonesianInupiatIranianIraqiIrishIroquoisIsraeliItalianJamaicanJapaneseJordanianKenyanKiowaKoreanLaotianLatvianLebaneseLiberianLithuanianLumbeeLuxembourgerMacedonianMalaysianMalteseMarshalleseMenomineeMexicanMexican American IndianMongolianMoroccanNative HawaiianNavajoNepaleseNew ZealanderNicaraguanNigerianNorthern EuropeanNorwegianOkinawanOsageOttawaPaiutePakistaniPalestinianPanamanianParaguayanPennsylvania GermanPeruvianPimaPolishPortuguesePotawatomiPuebloPuerto RicanPuget Sound SalishRomanianRussianSalvadoranSamoanScandinavianScotch-IrishScottishSeminoleSenegaleseSerbianShoshoneSierra LeoneanSiouxSlavicSlovakSloveneSomaliSouth AfricanSouth AmericanSouth American IndianSoviet UnionSpaniardSpanishSpanish AmericanSpanish American IndianSri LankanSudaneseSwedishSwissSyrianTaiwaneseThaiTlingit-HaidaTohono O'OdhamTonganTrinidadian and TobagonianTsimshianTurkishU.S. Virgin IslanderUgandanUkrainianUruguayanUteVenezuelanVietnameseWelshWest IndianYakamaYaquiYugoslavianYumanYup'ikZimbabwean
Immigration
NonimmigrantsImmigrantsAfghanistanAfricaAlbaniaArgentinaArmeniaAsiaAustraliaAustriaBahamasBangladeshBarbadosBelarusBelgiumBelizeBoliviaBosnia and HerzegovinaBrazilBulgariaBurma/MyanmarCabo VerdeCambodiaCameroonCanadaCaribbeanCentral AmericaChileChinaColombiaCongoCosta RicaCroatiaCubaCzechoslovakiaDenmarkDominicaDominican RepublicEastern AfricaEastern AsiaEastern EuropeEcuadorEgyptEl SalvadorEnglandEritreaEthiopiaEuropeFijiFranceGermanyGhanaGreeceGrenadaGuatemalaGuyanaHaitiHondurasHong KongHungaryIndiaIndonesiaIranIraqIrelandIsraelItalyJamaicaJapanJordanKazakhstanKenyaKoreaKuwaitLaosLatin AmericaLatviaLebanonLiberiaLithuaniaMalaysiaMexicoMicronesiaMiddle AfricaMoldovaMoroccoNepalNetherlandsNicaraguaNigeriaNorth AmericaNorth MacedoniaNorthern AfricaNorthern EuropeNorwayOceaniaPakistanPanamaPeruPhilippinesPolandPortugalRomaniaRussiaSaudi ArabiaScotlandSenegalSerbiaSierra LeoneSingaporeSomaliaSouth AfricaSouth AmericaSouth Central AsiaSouth Eastern AsiaSouthern EuropeSpainSri LankaSt. Vincent and the GrenadinesSudanSwedenSwitzerlandSyriaTaiwanThailandTrinidad and TobagoTurkeyUgandaUkraineUruguayUzbekistanVenezuelaVietnamWest IndiesWestern AfricaWestern AsiaWestern EuropeYemenZaireZimbabweAzores
Subsaharan African
Race
Ancestry
AfghanAfricanAlaska NativeAlaskan AthabascanAlbanianAleutAlsatianAmericanApacheArabArapahoArgentineanArmenianAssyrian/Chaldean/SyriacAustralianAustrianBahamianBangladeshiBarbadianBasqueBelgianBelizeanBermudanBhutaneseBlackfeetBolivianBrazilianBritishBritish West IndianBulgarianBurmeseCajunCambodianCanadianCape VerdeanCarpatho RusynCelticCentral AmericanCentral American IndianCherokeeCheyenneChickasawChileanChineseChippewaChoctawColombianColvilleComancheCosta RicanCreeCreekCroatianCrowCubanCypriotCzechCzechoslovakianDanishDelawareDominicanDutchDutch West IndianEastern EuropeanEcuadorianEgyptianEnglishEstonianEthiopianEuropeanFijianFilipinoFinnishFrenchFrench American IndianFrench CanadianGermanGerman RussianGhanaianGreekGuamanian/ChamorroGuatemalanGuyaneseHaitianHmongHonduranHopiHoumaHungarianIcelanderIndian (Asian)IndonesianInupiatIranianIraqiIrishIroquoisIsraeliItalianJamaicanJapaneseJordanianKenyanKiowaKoreanLaotianLatvianLebaneseLiberianLithuanianLumbeeLuxembourgerMacedonianMalaysianMalteseMarshalleseMenomineeMexicanMexican American IndianMongolianMoroccanNative HawaiianNavajoNepaleseNew ZealanderNicaraguanNigerianNorthern EuropeanNorwegianOkinawanOsageOttawaPaiutePalestinianPanamanianParaguayanPennsylvania GermanPeruvianPimaPolishPortuguesePotawatomiPuebloPuerto RicanPuget Sound SalishRomanianRussianSalvadoranSamoanScandinavianScotch-IrishScottishSeminoleSenegaleseSerbianShoshoneSierra LeoneanSiouxSlavicSlovakSloveneSomaliSouth AfricanSouth AmericanSouth American IndianSoviet UnionSpaniardSpanishSpanish AmericanSpanish American IndianSri LankanSubsaharan AfricanSudaneseSwedishSwissSyrianTaiwaneseThaiTlingit-HaidaTohono O'OdhamTonganTrinidadian and TobagonianTsimshianTurkishU.S. Virgin IslanderUgandanUkrainianUruguayanUteVenezuelanVietnameseWelshWest IndianYakamaYaquiYugoslavianYumanYup'ikZimbabwean
Immigration
NonimmigrantsImmigrantsAfghanistanAfricaAlbaniaArgentinaArmeniaAsiaAustraliaAustriaBahamasBangladeshBarbadosBelarusBelgiumBelizeBoliviaBosnia and HerzegovinaBrazilBulgariaBurma/MyanmarCabo VerdeCambodiaCameroonCanadaCaribbeanCentral AmericaChileChinaColombiaCongoCosta RicaCroatiaCubaCzechoslovakiaDenmarkDominicaDominican RepublicEastern AfricaEastern AsiaEastern EuropeEcuadorEgyptEl SalvadorEnglandEritreaEthiopiaEuropeFijiFranceGermanyGhanaGreeceGrenadaGuatemalaGuyanaHaitiHondurasHong KongHungaryIndiaIndonesiaIranIraqIrelandIsraelItalyJamaicaJapanJordanKazakhstanKenyaKoreaKuwaitLaosLatin AmericaLatviaLebanonLiberiaLithuaniaMalaysiaMexicoMicronesiaMiddle AfricaMoldovaMoroccoNepalNetherlandsNicaraguaNigeriaNorth AmericaNorth MacedoniaNorthern AfricaNorthern EuropeNorwayOceaniaPakistanPanamaPeruPhilippinesPolandPortugalRomaniaRussiaSaudi ArabiaScotlandSenegalSerbiaSierra LeoneSingaporeSomaliaSouth AfricaSouth AmericaSouth Central AsiaSouth Eastern AsiaSouthern EuropeSpainSri LankaSt. Vincent and the GrenadinesSudanSwedenSwitzerlandSyriaTaiwanThailandTrinidad and TobagoTurkeyUgandaUkraineUruguayUzbekistanVenezuelaVietnamWest IndiesWestern AfricaWestern AsiaWestern EuropeYemenZaireZimbabweAzores
Receiving Food Stamps
Income
Poverty
Unemployment
Labor Participation
Family Structure
Vehicle Availability
Education Level
Disability

Receiving Food Stamps Comparison

Pakistanis

Sub-Saharan Africans

Exceptional
Tragic
10.4%
RECEIVING FOOD STAMPS
95.9/ 100
METRIC RATING
110th/ 347
METRIC RANK
14.1%
RECEIVING FOOD STAMPS
0.3/ 100
METRIC RATING
255th/ 347
METRIC RANK

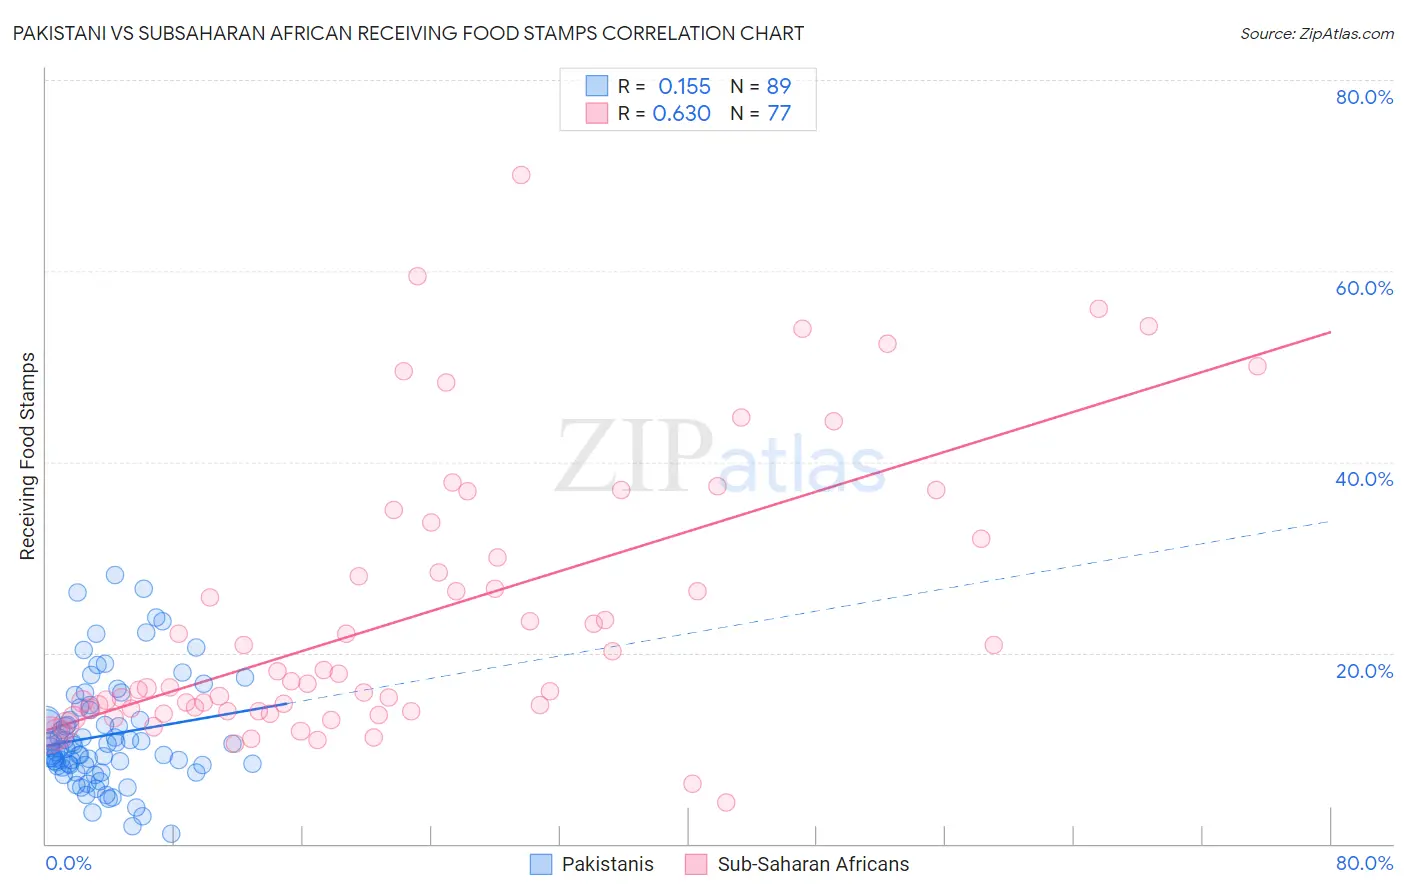
Pakistani vs Subsaharan African Receiving Food Stamps Correlation Chart

The statistical analysis conducted on geographies consisting of 334,714,196 people shows a poor positive correlation between the proportion of Pakistanis and percentage of population receiving government assistance and/or food stamps in the United States with a correlation coefficient (R) of 0.155 and weighted average of 10.4%. Similarly, the statistical analysis conducted on geographies consisting of 506,389,803 people shows a significant positive correlation between the proportion of Sub-Saharan Africans and percentage of population receiving government assistance and/or food stamps in the United States with a correlation coefficient (R) of 0.630 and weighted average of 14.1%, a difference of 34.9%.
Pakistani vs Subsaharan African Receiving Food Stamps

Receiving Food Stamps Correlation Summary

MeasurementPakistaniSubsaharan African
Minimum1.1%4.3%
Maximum28.2%70.0%
Range27.1%65.7%
Mean11.3%23.8%
Median10.1%16.8%
Interquartile 25% (IQ1)8.2%13.9%
Interquartile 75% (IQ3)13.5%31.0%
Interquartile Range (IQR)5.3%17.1%
Standard Deviation (Sample)5.6%14.4%
Standard Deviation (Population)5.6%14.3%

Similar Demographics by Receiving Food Stamps

Demographics Similar to Pakistanis by Receiving Food Stamps

In terms of receiving food stamps, the demographic groups most similar to Pakistanis are Romanian (10.4%, a difference of 0.10%), Mongolian (10.5%, a difference of 0.11%), Immigrants from Pakistan (10.4%, a difference of 0.28%), Carpatho Rusyn (10.4%, a difference of 0.33%), and Korean (10.4%, a difference of 0.36%).
DemographicsRating | RankReceiving Food Stamps
Immigrants | Latvia
96.8
/100
|
#103
Exceptional
10.3%
Immigrants | Hungary
96.7
/100
|
#104
Exceptional
10.3%
Immigrants | Malaysia
96.5
/100
|
#105
Exceptional
10.4%
Immigrants | Italy
96.4
/100
|
#106
Exceptional
10.4%
Koreans
96.3
/100
|
#107
Exceptional
10.4%
Carpatho Rusyns
96.2
/100
|
#108
Exceptional
10.4%
Immigrants | Pakistan
96.2
/100
|
#109
Exceptional
10.4%
Pakistanis
95.9
/100
|
#110
Exceptional
10.4%
Romanians
95.8
/100
|
#111
Exceptional
10.4%
Mongolians
95.8
/100
|
#112
Exceptional
10.5%
Icelanders
95.4
/100
|
#113
Exceptional
10.5%
Scotch-Irish
95.1
/100
|
#114
Exceptional
10.5%
Immigrants | Saudi Arabia
94.9
/100
|
#115
Exceptional
10.5%
Canadians
94.8
/100
|
#116
Exceptional
10.5%
Immigrants | Nepal
94.6
/100
|
#117
Exceptional
10.6%

Demographics Similar to Sub-Saharan Africans by Receiving Food Stamps

In terms of receiving food stamps, the demographic groups most similar to Sub-Saharan Africans are Marshallese (14.1%, a difference of 0.010%), Japanese (14.1%, a difference of 0.020%), Arapaho (14.1%, a difference of 0.12%), Immigrants from Ghana (14.1%, a difference of 0.20%), and Creek (14.1%, a difference of 0.33%).
DemographicsRating | RankReceiving Food Stamps
Immigrants | Laos
0.7
/100
|
#248
Tragic
13.8%
Indonesians
0.6
/100
|
#249
Tragic
13.9%
Immigrants | Cambodia
0.5
/100
|
#250
Tragic
13.9%
Yaqui
0.5
/100
|
#251
Tragic
13.9%
Ghanaians
0.5
/100
|
#252
Tragic
14.0%
Spanish Americans
0.4
/100
|
#253
Tragic
14.0%
Marshallese
0.3
/100
|
#254
Tragic
14.1%
Sub-Saharan Africans
0.3
/100
|
#255
Tragic
14.1%
Japanese
0.3
/100
|
#256
Tragic
14.1%
Arapaho
0.3
/100
|
#257
Tragic
14.1%
Immigrants | Ghana
0.3
/100
|
#258
Tragic
14.1%
Creek
0.3
/100
|
#259
Tragic
14.1%
Central Americans
0.3
/100
|
#260
Tragic
14.1%
Immigrants | Congo
0.3
/100
|
#261
Tragic
14.1%
Paiute
0.2
/100
|
#262
Tragic
14.3%