Ottawa vs Russian Single Father Poverty
COMPARE
Ottawa
Russian
Single Father Poverty
Single Father Poverty Comparison
Ottawa
Russians
18.6%
SINGLE FATHER POVERTY
0.0/ 100
METRIC RATING
308th/ 347
METRIC RANK
16.4%
SINGLE FATHER POVERTY
30.1/ 100
METRIC RATING
188th/ 347
METRIC RANK
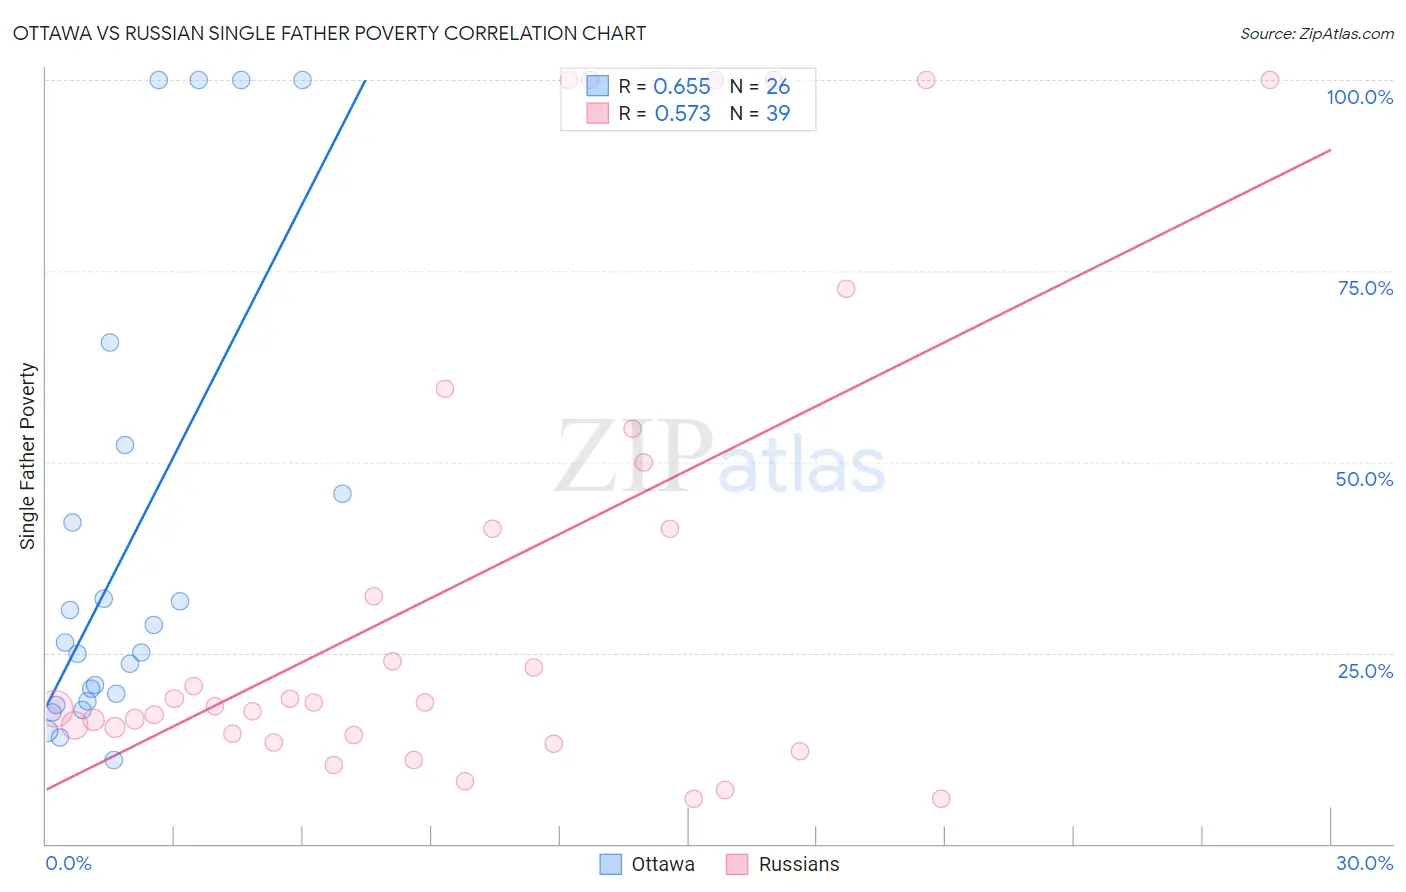
Ottawa vs Russian Single Father Poverty Correlation Chart
The statistical analysis conducted on geographies consisting of 45,685,230 people shows a significant positive correlation between the proportion of Ottawa and poverty level among single fathers in the United States with a correlation coefficient (R) of 0.655 and weighted average of 18.6%. Similarly, the statistical analysis conducted on geographies consisting of 378,661,966 people shows a substantial positive correlation between the proportion of Russians and poverty level among single fathers in the United States with a correlation coefficient (R) of 0.573 and weighted average of 16.4%, a difference of 12.9%.
Single Father Poverty Correlation Summary
| Measurement | Ottawa | Russian |
| Minimum | 10.9% | 5.9% |
| Maximum | 100.0% | 100.0% |
| Range | 89.1% | 94.1% |
| Mean | 38.5% | 34.4% |
| Median | 25.7% | 18.4% |
| Interquartile 25% (IQ1) | 18.7% | 14.2% |
| Interquartile 75% (IQ3) | 45.8% | 50.0% |
| Interquartile Range (IQR) | 27.1% | 35.8% |
| Standard Deviation (Sample) | 29.5% | 32.0% |
| Standard Deviation (Population) | 28.9% | 31.6% |
Similar Demographics by Single Father Poverty
Demographics Similar to Ottawa by Single Father Poverty
In terms of single father poverty, the demographic groups most similar to Ottawa are French Canadian (18.6%, a difference of 0.020%), Scotch-Irish (18.6%, a difference of 0.060%), Immigrants from Micronesia (18.6%, a difference of 0.11%), Blackfeet (18.5%, a difference of 0.28%), and Ute (18.5%, a difference of 0.33%).
| Demographics | Rating | Rank | Single Father Poverty |
| Hungarians | 0.0 /100 | #301 | Tragic 18.5% |
| Comanche | 0.0 /100 | #302 | Tragic 18.5% |
| Celtics | 0.0 /100 | #303 | Tragic 18.5% |
| Ute | 0.0 /100 | #304 | Tragic 18.5% |
| Blackfeet | 0.0 /100 | #305 | Tragic 18.5% |
| Scotch-Irish | 0.0 /100 | #306 | Tragic 18.6% |
| French Canadians | 0.0 /100 | #307 | Tragic 18.6% |
| Ottawa | 0.0 /100 | #308 | Tragic 18.6% |
| Immigrants | Micronesia | 0.0 /100 | #309 | Tragic 18.6% |
| Chippewa | 0.0 /100 | #310 | Tragic 18.8% |
| Immigrants | Nonimmigrants | 0.0 /100 | #311 | Tragic 18.8% |
| Immigrants | Dominica | 0.0 /100 | #312 | Tragic 18.9% |
| Potawatomi | 0.0 /100 | #313 | Tragic 18.9% |
| Delaware | 0.0 /100 | #314 | Tragic 18.9% |
| Chickasaw | 0.0 /100 | #315 | Tragic 19.0% |
Demographics Similar to Russians by Single Father Poverty
In terms of single father poverty, the demographic groups most similar to Russians are Ukrainian (16.4%, a difference of 0.020%), Immigrants from Venezuela (16.4%, a difference of 0.050%), Latvian (16.5%, a difference of 0.060%), Immigrants from Burma/Myanmar (16.5%, a difference of 0.11%), and Immigrants from Guyana (16.5%, a difference of 0.16%).
| Demographics | Rating | Rank | Single Father Poverty |
| Immigrants | Western Africa | 36.0 /100 | #181 | Fair 16.4% |
| Immigrants | Italy | 35.7 /100 | #182 | Fair 16.4% |
| Aleuts | 35.3 /100 | #183 | Fair 16.4% |
| Cambodians | 34.6 /100 | #184 | Fair 16.4% |
| Panamanians | 33.6 /100 | #185 | Fair 16.4% |
| Immigrants | Venezuela | 31.0 /100 | #186 | Fair 16.4% |
| Ukrainians | 30.4 /100 | #187 | Fair 16.4% |
| Russians | 30.1 /100 | #188 | Fair 16.4% |
| Latvians | 28.9 /100 | #189 | Fair 16.5% |
| Immigrants | Burma/Myanmar | 28.0 /100 | #190 | Fair 16.5% |
| Immigrants | Guyana | 27.1 /100 | #191 | Fair 16.5% |
| Immigrants | Switzerland | 24.8 /100 | #192 | Fair 16.5% |
| Ecuadorians | 24.5 /100 | #193 | Fair 16.5% |
| Cape Verdeans | 24.4 /100 | #194 | Fair 16.5% |
| Immigrants | Barbados | 24.3 /100 | #195 | Fair 16.5% |