Osage vs Arab Receiving Food Stamps
COMPARE
Osage
Arab
Receiving Food Stamps
Receiving Food Stamps Comparison
Osage
Arabs
11.7%
RECEIVING FOOD STAMPS
49.8/ 100
METRIC RATING
175th/ 347
METRIC RANK
11.5%
RECEIVING FOOD STAMPS
64.7/ 100
METRIC RATING
165th/ 347
METRIC RANK
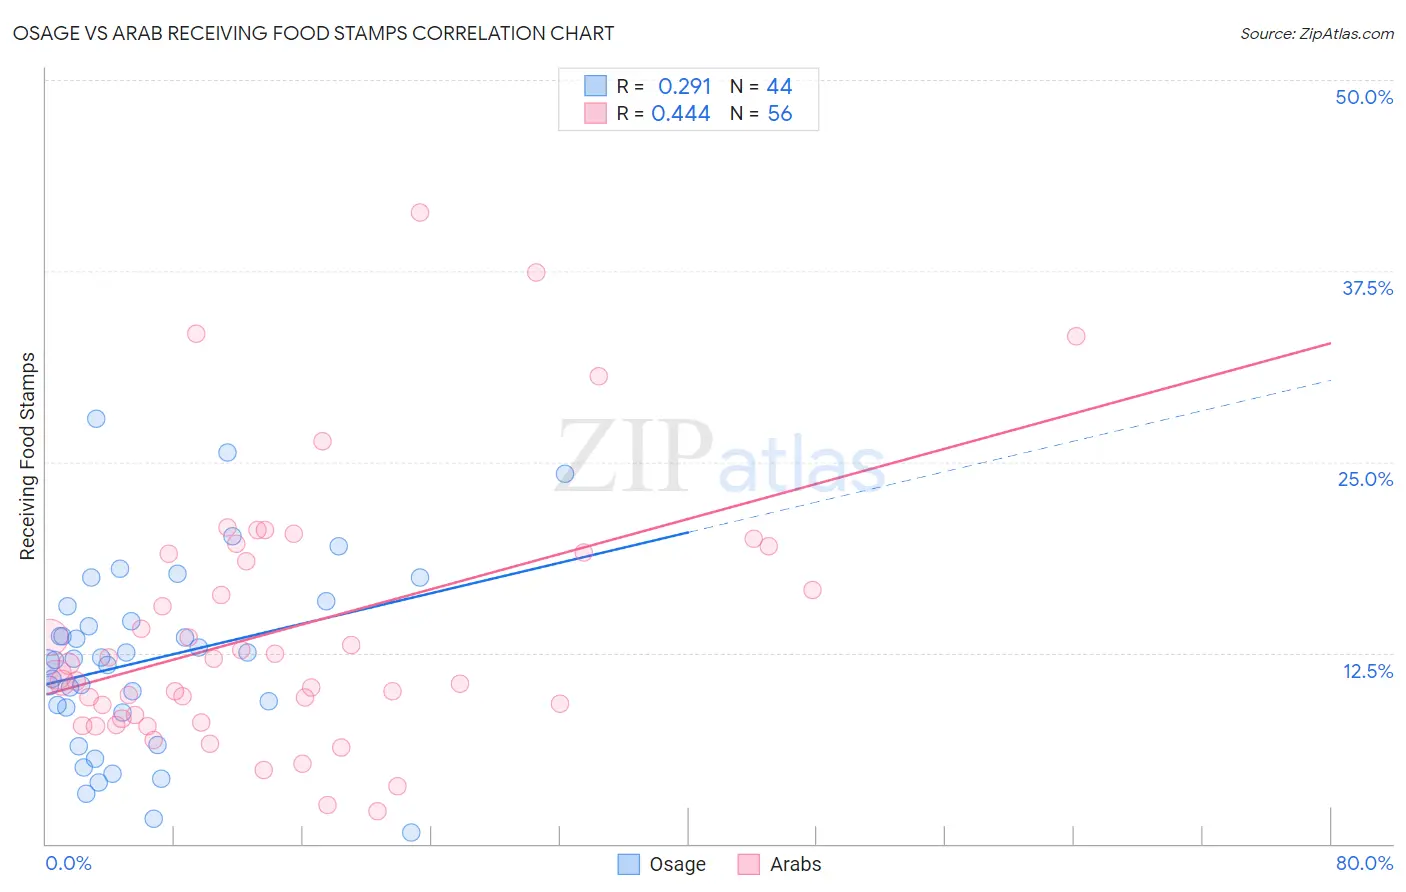
Osage vs Arab Receiving Food Stamps Correlation Chart
The statistical analysis conducted on geographies consisting of 91,766,497 people shows a weak positive correlation between the proportion of Osage and percentage of population receiving government assistance and/or food stamps in the United States with a correlation coefficient (R) of 0.291 and weighted average of 11.7%. Similarly, the statistical analysis conducted on geographies consisting of 484,746,764 people shows a moderate positive correlation between the proportion of Arabs and percentage of population receiving government assistance and/or food stamps in the United States with a correlation coefficient (R) of 0.444 and weighted average of 11.5%, a difference of 2.2%.
Receiving Food Stamps Correlation Summary
| Measurement | Osage | Arab |
| Minimum | 0.70% | 2.1% |
| Maximum | 27.8% | 41.3% |
| Range | 27.1% | 39.2% |
| Mean | 12.0% | 14.1% |
| Median | 12.1% | 11.4% |
| Interquartile 25% (IQ1) | 8.7% | 8.3% |
| Interquartile 75% (IQ3) | 15.0% | 19.0% |
| Interquartile Range (IQR) | 6.3% | 10.7% |
| Standard Deviation (Sample) | 6.1% | 8.5% |
| Standard Deviation (Population) | 6.0% | 8.5% |
Demographics Similar to Osage and Arabs by Receiving Food Stamps
In terms of receiving food stamps, the demographic groups most similar to Osage are Immigrants from Eritrea (11.7%, a difference of 0.020%), Peruvian (11.7%, a difference of 0.070%), Immigrants from Ukraine (11.8%, a difference of 0.21%), German Russian (11.8%, a difference of 0.24%), and Immigrants from Kenya (11.8%, a difference of 0.48%). Similarly, the demographic groups most similar to Arabs are Immigrants from Chile (11.5%, a difference of 0.050%), Immigrants from Southern Europe (11.5%, a difference of 0.17%), Immigrants from Belarus (11.5%, a difference of 0.30%), Alsatian (11.4%, a difference of 0.54%), and Pennsylvania German (11.4%, a difference of 0.60%).
| Demographics | Rating | Rank | Receiving Food Stamps |
| French Canadians | 69.5 /100 | #160 | Good 11.4% |
| Pennsylvania Germans | 68.4 /100 | #161 | Good 11.4% |
| Alsatians | 68.0 /100 | #162 | Good 11.4% |
| Immigrants | Southern Europe | 65.8 /100 | #163 | Good 11.5% |
| Immigrants | Chile | 65.0 /100 | #164 | Good 11.5% |
| Arabs | 64.7 /100 | #165 | Good 11.5% |
| Immigrants | Belarus | 62.8 /100 | #166 | Good 11.5% |
| Kenyans | 60.2 /100 | #167 | Good 11.6% |
| Tlingit-Haida | 59.1 /100 | #168 | Average 11.6% |
| Immigrants | Eastern Africa | 58.3 /100 | #169 | Average 11.6% |
| Costa Ricans | 57.9 /100 | #170 | Average 11.6% |
| Immigrants | Western Asia | 56.4 /100 | #171 | Average 11.6% |
| Guamanians/Chamorros | 54.2 /100 | #172 | Average 11.7% |
| Immigrants | Syria | 53.4 /100 | #173 | Average 11.7% |
| Immigrants | Eritrea | 50.0 /100 | #174 | Average 11.7% |
| Osage | 49.8 /100 | #175 | Average 11.7% |
| Peruvians | 49.3 /100 | #176 | Average 11.7% |
| Immigrants | Ukraine | 48.4 /100 | #177 | Average 11.8% |
| German Russians | 48.1 /100 | #178 | Average 11.8% |
| Immigrants | Kenya | 46.4 /100 | #179 | Average 11.8% |
| Uruguayans | 44.8 /100 | #180 | Average 11.8% |