Marshallese vs Immigrants from Denmark Child Poverty Among Girls Under 16

COMPARE

Marshallese
Race
Ancestry
AfghanAfricanAlaska NativeAlaskan AthabascanAlbanianAleutAlsatianAmericanApacheArabArapahoArgentineanArmenianAssyrian/Chaldean/SyriacAustralianAustrianBahamianBangladeshiBarbadianBasqueBelgianBelizeanBermudanBhutaneseBlackfeetBolivianBrazilianBritishBritish West IndianBulgarianBurmeseCajunCambodianCanadianCape VerdeanCarpatho RusynCelticCentral AmericanCentral American IndianCherokeeCheyenneChickasawChileanChineseChippewaChoctawColombianColvilleComancheCosta RicanCreeCreekCroatianCrowCubanCypriotCzechCzechoslovakianDanishDelawareDominicanDutchDutch West IndianEastern EuropeanEcuadorianEgyptianEnglishEstonianEthiopianEuropeanFijianFilipinoFinnishFrenchFrench American IndianFrench CanadianGermanGerman RussianGhanaianGreekGuamanian/ChamorroGuatemalanGuyaneseHaitianHmongHonduranHopiHoumaHungarianIcelanderIndian (Asian)IndonesianInupiatIranianIraqiIrishIroquoisIsraeliItalianJamaicanJapaneseJordanianKenyanKiowaKoreanLaotianLatvianLebaneseLiberianLithuanianLumbeeLuxembourgerMacedonianMalaysianMalteseMarshalleseMenomineeMexicanMexican American IndianMongolianMoroccanNative HawaiianNavajoNepaleseNew ZealanderNicaraguanNigerianNorthern EuropeanNorwegianOkinawanOsageOttawaPaiutePakistaniPalestinianPanamanianParaguayanPennsylvania GermanPeruvianPimaPolishPortuguesePotawatomiPuebloPuerto RicanPuget Sound SalishRomanianRussianSalvadoranSamoanScandinavianScotch-IrishScottishSeminoleSenegaleseSerbianShoshoneSierra LeoneanSiouxSlavicSlovakSloveneSomaliSouth AfricanSouth AmericanSouth American IndianSoviet UnionSpaniardSpanishSpanish AmericanSpanish American IndianSri LankanSubsaharan AfricanSudaneseSwedishSwissSyrianTaiwaneseThaiTlingit-HaidaTohono O'OdhamTonganTrinidadian and TobagonianTsimshianTurkishU.S. Virgin IslanderUgandanUkrainianUruguayanUteVenezuelanVietnameseWelshWest IndianYakamaYaquiYugoslavianYumanYup'ikZimbabwean
Immigration
NonimmigrantsImmigrantsAfghanistanAfricaAlbaniaArgentinaArmeniaAsiaAustraliaAustriaBahamasBangladeshBarbadosBelarusBelgiumBelizeBoliviaBosnia and HerzegovinaBrazilBulgariaBurma/MyanmarCabo VerdeCambodiaCameroonCanadaCaribbeanCentral AmericaChileChinaColombiaCongoCosta RicaCroatiaCubaCzechoslovakiaDominicaDominican RepublicEastern AfricaEastern AsiaEastern EuropeEcuadorEgyptEl SalvadorEnglandEritreaEthiopiaEuropeFijiFranceGermanyGhanaGreeceGrenadaGuatemalaGuyanaHaitiHondurasHong KongHungaryIndiaIndonesiaIranIraqIrelandIsraelItalyJamaicaJapanJordanKazakhstanKenyaKoreaKuwaitLaosLatin AmericaLatviaLebanonLiberiaLithuaniaMalaysiaMexicoMicronesiaMiddle AfricaMoldovaMoroccoNepalNetherlandsNicaraguaNigeriaNorth AmericaNorth MacedoniaNorthern AfricaNorthern EuropeNorwayOceaniaPakistanPanamaPeruPhilippinesPolandPortugalRomaniaRussiaSaudi ArabiaScotlandSenegalSerbiaSierra LeoneSingaporeSomaliaSouth AfricaSouth AmericaSouth Central AsiaSouth Eastern AsiaSouthern EuropeSpainSri LankaSt. Vincent and the GrenadinesSudanSwedenSwitzerlandSyriaTaiwanThailandTrinidad and TobagoTurkeyUgandaUkraineUruguayUzbekistanVenezuelaVietnamWest IndiesWestern AfricaWestern AsiaWestern EuropeYemenZaireZimbabweAzores
Immigrants from Denmark
Race
Ancestry
AfghanAfricanAlaska NativeAlaskan AthabascanAlbanianAleutAlsatianAmericanApacheArabArapahoArgentineanArmenianAssyrian/Chaldean/SyriacAustralianAustrianBahamianBangladeshiBarbadianBasqueBelgianBelizeanBermudanBhutaneseBlackfeetBolivianBrazilianBritishBritish West IndianBulgarianBurmeseCajunCambodianCanadianCape VerdeanCarpatho RusynCelticCentral AmericanCentral American IndianCherokeeCheyenneChickasawChileanChineseChippewaChoctawColombianColvilleComancheCosta RicanCreeCreekCroatianCrowCubanCypriotCzechCzechoslovakianDanishDelawareDominicanDutchDutch West IndianEastern EuropeanEcuadorianEgyptianEnglishEstonianEthiopianEuropeanFijianFilipinoFinnishFrenchFrench American IndianFrench CanadianGermanGerman RussianGhanaianGreekGuamanian/ChamorroGuatemalanGuyaneseHaitianHmongHonduranHopiHoumaHungarianIcelanderIndian (Asian)IndonesianInupiatIranianIraqiIrishIroquoisIsraeliItalianJamaicanJapaneseJordanianKenyanKiowaKoreanLaotianLatvianLebaneseLiberianLithuanianLumbeeLuxembourgerMacedonianMalaysianMalteseMenomineeMexicanMexican American IndianMongolianMoroccanNative HawaiianNavajoNepaleseNew ZealanderNicaraguanNigerianNorthern EuropeanNorwegianOkinawanOsageOttawaPaiutePakistaniPalestinianPanamanianParaguayanPennsylvania GermanPeruvianPimaPolishPortuguesePotawatomiPuebloPuerto RicanPuget Sound SalishRomanianRussianSalvadoranSamoanScandinavianScotch-IrishScottishSeminoleSenegaleseSerbianShoshoneSierra LeoneanSiouxSlavicSlovakSloveneSomaliSouth AfricanSouth AmericanSouth American IndianSoviet UnionSpaniardSpanishSpanish AmericanSpanish American IndianSri LankanSubsaharan AfricanSudaneseSwedishSwissSyrianTaiwaneseThaiTlingit-HaidaTohono O'OdhamTonganTrinidadian and TobagonianTsimshianTurkishU.S. Virgin IslanderUgandanUkrainianUruguayanUteVenezuelanVietnameseWelshWest IndianYakamaYaquiYugoslavianYumanYup'ikZimbabwean
Immigration
NonimmigrantsImmigrantsAfghanistanAfricaAlbaniaArgentinaArmeniaAsiaAustraliaAustriaBahamasBangladeshBarbadosBelarusBelgiumBelizeBoliviaBosnia and HerzegovinaBrazilBulgariaBurma/MyanmarCabo VerdeCambodiaCameroonCanadaCaribbeanCentral AmericaChileChinaColombiaCongoCosta RicaCroatiaCubaCzechoslovakiaDenmarkDominicaDominican RepublicEastern AfricaEastern AsiaEastern EuropeEcuadorEgyptEl SalvadorEnglandEritreaEthiopiaEuropeFijiFranceGermanyGhanaGreeceGrenadaGuatemalaGuyanaHaitiHondurasHong KongHungaryIndiaIndonesiaIranIraqIrelandIsraelItalyJamaicaJapanJordanKazakhstanKenyaKoreaKuwaitLaosLatin AmericaLatviaLebanonLiberiaLithuaniaMalaysiaMexicoMicronesiaMiddle AfricaMoldovaMoroccoNepalNetherlandsNicaraguaNigeriaNorth AmericaNorth MacedoniaNorthern AfricaNorthern EuropeNorwayOceaniaPakistanPanamaPeruPhilippinesPolandPortugalRomaniaRussiaSaudi ArabiaScotlandSenegalSerbiaSierra LeoneSingaporeSomaliaSouth AfricaSouth AmericaSouth Central AsiaSouth Eastern AsiaSouthern EuropeSpainSri LankaSt. Vincent and the GrenadinesSudanSwedenSwitzerlandSyriaTaiwanThailandTrinidad and TobagoTurkeyUgandaUkraineUruguayUzbekistanVenezuelaVietnamWest IndiesWestern AfricaWestern AsiaWestern EuropeYemenZaireZimbabweAzores
Child Poverty Among Girls Under 16
Income
Poverty
Unemployment
Labor Participation
Family Structure
Vehicle Availability
Education Level
Disability

Child Poverty Among Girls Under 16 Comparison

Marshallese

Immigrants from Denmark

Tragic
Exceptional
18.7%
CHILD POVERTY AMONG GIRLS UNDER 16
0.9/ 100
METRIC RATING
239th/ 347
METRIC RANK
15.2%
CHILD POVERTY AMONG GIRLS UNDER 16
93.3/ 100
METRIC RATING
116th/ 347
METRIC RANK

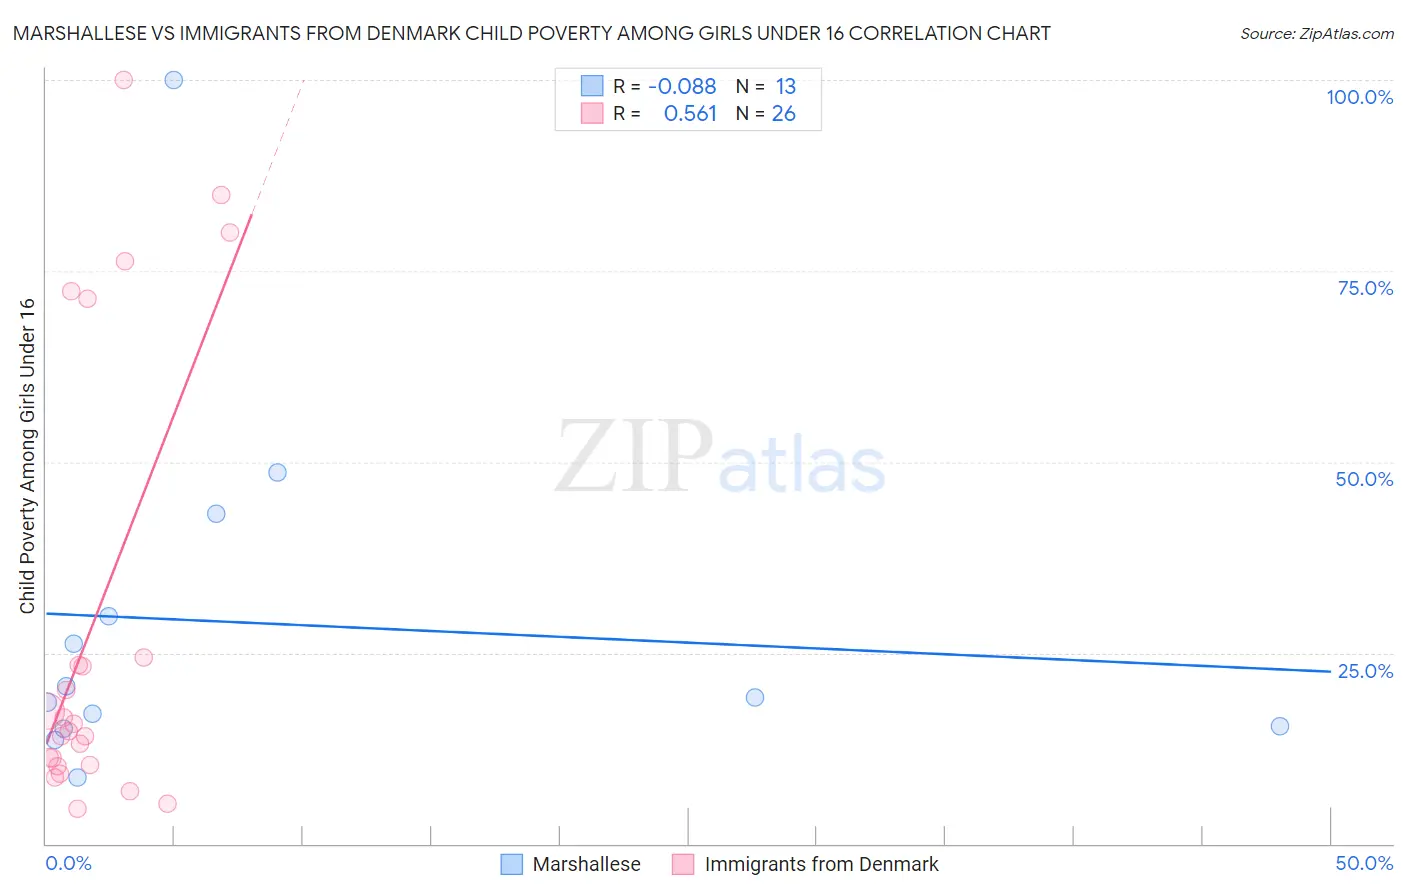
Marshallese vs Immigrants from Denmark Child Poverty Among Girls Under 16 Correlation Chart

The statistical analysis conducted on geographies consisting of 14,733,335 people shows a slight negative correlation between the proportion of Marshallese and poverty level among girls under the age of 16 in the United States with a correlation coefficient (R) of -0.088 and weighted average of 18.7%. Similarly, the statistical analysis conducted on geographies consisting of 135,139,155 people shows a substantial positive correlation between the proportion of Immigrants from Denmark and poverty level among girls under the age of 16 in the United States with a correlation coefficient (R) of 0.561 and weighted average of 15.2%, a difference of 22.7%.
Marshallese vs Immigrants from Denmark Child Poverty Among Girls Under 16

Child Poverty Among Girls Under 16 Correlation Summary

MeasurementMarshalleseImmigrants from Denmark
Minimum8.7%4.6%
Maximum100.0%100.0%
Range91.3%95.4%
Mean28.9%29.2%
Median19.2%15.3%
Interquartile 25% (IQ1)15.2%10.3%
Interquartile 75% (IQ3)36.5%24.4%
Interquartile Range (IQR)21.3%14.1%
Standard Deviation (Sample)24.3%29.7%
Standard Deviation (Population)23.3%29.1%

Similar Demographics by Child Poverty Among Girls Under 16

Demographics Similar to Marshallese by Child Poverty Among Girls Under 16

In terms of child poverty among girls under 16, the demographic groups most similar to Marshallese are Immigrants from Eritrea (18.7%, a difference of 0.070%), Nigerian (18.7%, a difference of 0.14%), Immigrants from Nigeria (18.6%, a difference of 0.21%), Alsatian (18.6%, a difference of 0.33%), and Nepalese (18.6%, a difference of 0.35%).
DemographicsRating | RankChild Poverty Among Girls Under 16
Immigrants | Sudan
1.1
/100
|
#232
Tragic
18.6%
Sudanese
1.1
/100
|
#233
Tragic
18.6%
Fijians
1.1
/100
|
#234
Tragic
18.6%
Nepalese
1.1
/100
|
#235
Tragic
18.6%
Alsatians
1.1
/100
|
#236
Tragic
18.6%
Immigrants | Nigeria
1.0
/100
|
#237
Tragic
18.6%
Immigrants | Eritrea
1.0
/100
|
#238
Tragic
18.7%
Marshallese
0.9
/100
|
#239
Tragic
18.7%
Nigerians
0.9
/100
|
#240
Tragic
18.7%
Americans
0.8
/100
|
#241
Tragic
18.8%
Immigrants | Cuba
0.7
/100
|
#242
Tragic
18.8%
Immigrants | Nicaragua
0.7
/100
|
#243
Tragic
18.8%
Ecuadorians
0.7
/100
|
#244
Tragic
18.8%
Shoshone
0.6
/100
|
#245
Tragic
18.9%
Immigrants | Laos
0.6
/100
|
#246
Tragic
18.9%

Demographics Similar to Immigrants from Denmark by Child Poverty Among Girls Under 16

In terms of child poverty among girls under 16, the demographic groups most similar to Immigrants from Denmark are Immigrants from North Macedonia (15.2%, a difference of 0.090%), Immigrants from Southern Europe (15.3%, a difference of 0.28%), Belgian (15.2%, a difference of 0.31%), Sri Lankan (15.2%, a difference of 0.38%), and Immigrants from Zimbabwe (15.3%, a difference of 0.38%).
DemographicsRating | RankChild Poverty Among Girls Under 16
Serbians
94.8
/100
|
#109
Exceptional
15.1%
Immigrants | Croatia
94.6
/100
|
#110
Exceptional
15.1%
Palestinians
94.5
/100
|
#111
Exceptional
15.1%
Immigrants | Kazakhstan
94.3
/100
|
#112
Exceptional
15.1%
Dutch
94.3
/100
|
#113
Exceptional
15.1%
Sri Lankans
94.0
/100
|
#114
Exceptional
15.2%
Belgians
93.9
/100
|
#115
Exceptional
15.2%
Immigrants | Denmark
93.3
/100
|
#116
Exceptional
15.2%
Immigrants | North Macedonia
93.1
/100
|
#117
Exceptional
15.2%
Immigrants | Southern Europe
92.7
/100
|
#118
Exceptional
15.3%
Immigrants | Zimbabwe
92.5
/100
|
#119
Exceptional
15.3%
Pakistanis
92.3
/100
|
#120
Exceptional
15.3%
English
92.2
/100
|
#121
Exceptional
15.3%
Portuguese
91.8
/100
|
#122
Exceptional
15.3%
Irish
91.5
/100
|
#123
Exceptional
15.3%