Cuban vs Immigrants from Denmark Child Poverty Among Girls Under 16
COMPARE
Cuban
Immigrants from Denmark
Child Poverty Among Girls Under 16
Child Poverty Among Girls Under 16 Comparison
Cubans
Immigrants from Denmark
18.0%
CHILD POVERTY AMONG GIRLS UNDER 16
4.1/ 100
METRIC RATING
220th/ 347
METRIC RANK
15.2%
CHILD POVERTY AMONG GIRLS UNDER 16
93.3/ 100
METRIC RATING
116th/ 347
METRIC RANK
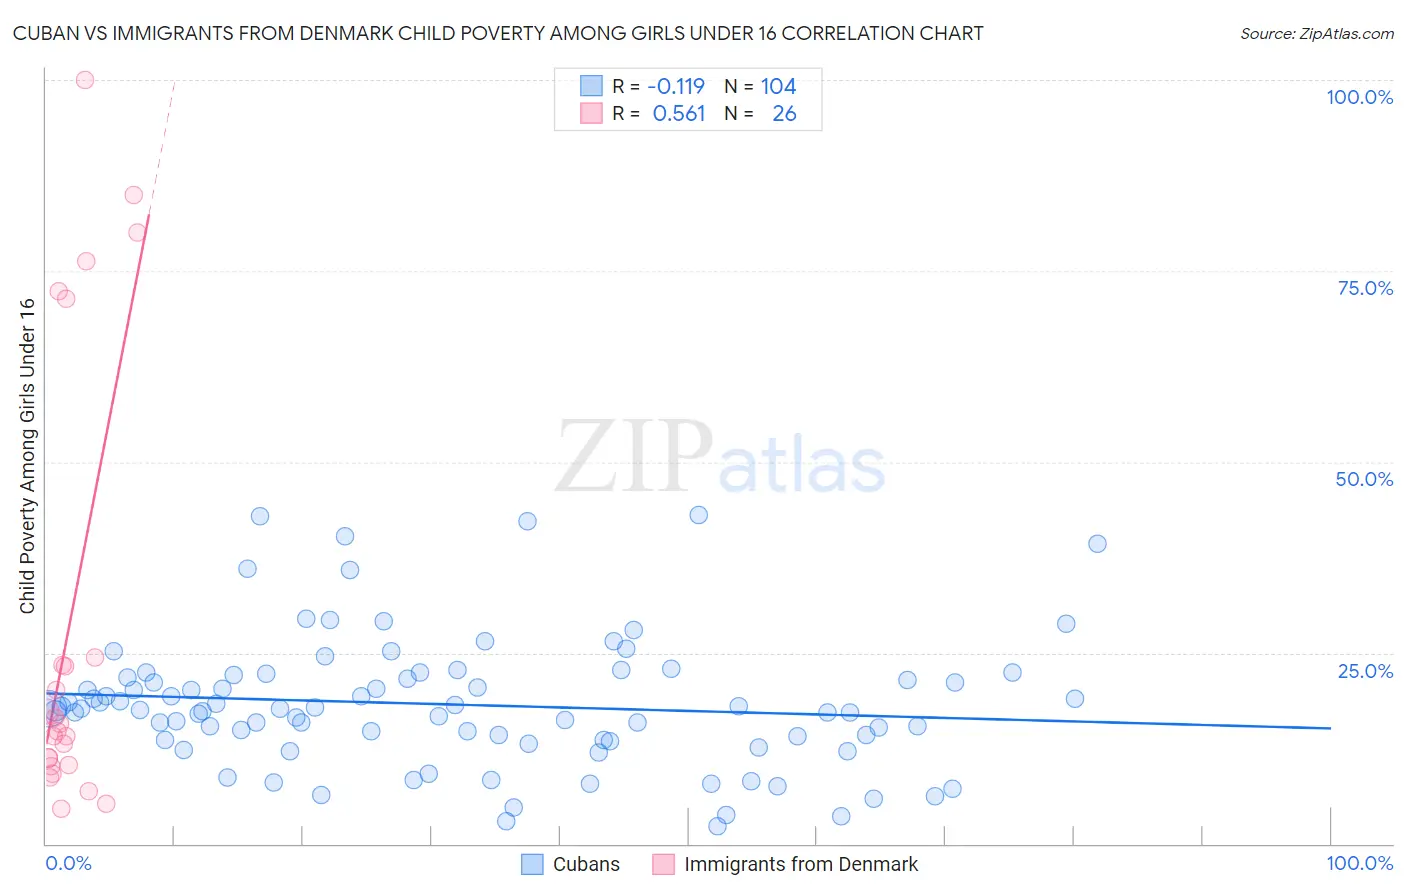
Cuban vs Immigrants from Denmark Child Poverty Among Girls Under 16 Correlation Chart
The statistical analysis conducted on geographies consisting of 440,192,797 people shows a poor negative correlation between the proportion of Cubans and poverty level among girls under the age of 16 in the United States with a correlation coefficient (R) of -0.119 and weighted average of 18.0%. Similarly, the statistical analysis conducted on geographies consisting of 135,139,155 people shows a substantial positive correlation between the proportion of Immigrants from Denmark and poverty level among girls under the age of 16 in the United States with a correlation coefficient (R) of 0.561 and weighted average of 15.2%, a difference of 18.0%.
Child Poverty Among Girls Under 16 Correlation Summary
| Measurement | Cuban | Immigrants from Denmark |
| Minimum | 2.3% | 4.6% |
| Maximum | 43.1% | 100.0% |
| Range | 40.8% | 95.4% |
| Mean | 18.2% | 29.2% |
| Median | 17.6% | 15.3% |
| Interquartile 25% (IQ1) | 13.7% | 10.3% |
| Interquartile 75% (IQ3) | 21.9% | 24.4% |
| Interquartile Range (IQR) | 8.3% | 14.1% |
| Standard Deviation (Sample) | 8.5% | 29.7% |
| Standard Deviation (Population) | 8.5% | 29.1% |
Similar Demographics by Child Poverty Among Girls Under 16
Demographics Similar to Cubans by Child Poverty Among Girls Under 16
In terms of child poverty among girls under 16, the demographic groups most similar to Cubans are Immigrants from Panama (17.9%, a difference of 0.38%), Immigrants from Micronesia (18.0%, a difference of 0.43%), Alaska Native (17.8%, a difference of 0.62%), Japanese (17.8%, a difference of 0.72%), and Moroccan (17.8%, a difference of 0.80%).
| Demographics | Rating | Rank | Child Poverty Among Girls Under 16 |
| Pennsylvania Germans | 5.7 /100 | #213 | Tragic 17.8% |
| Malaysians | 5.7 /100 | #214 | Tragic 17.8% |
| German Russians | 5.7 /100 | #215 | Tragic 17.8% |
| Moroccans | 5.5 /100 | #216 | Tragic 17.8% |
| Japanese | 5.3 /100 | #217 | Tragic 17.8% |
| Alaska Natives | 5.2 /100 | #218 | Tragic 17.8% |
| Immigrants | Panama | 4.7 /100 | #219 | Tragic 17.9% |
| Cubans | 4.1 /100 | #220 | Tragic 18.0% |
| Immigrants | Micronesia | 3.5 /100 | #221 | Tragic 18.0% |
| Immigrants | Cambodia | 2.9 /100 | #222 | Tragic 18.1% |
| Immigrants | Armenia | 2.9 /100 | #223 | Tragic 18.1% |
| Bermudans | 2.8 /100 | #224 | Tragic 18.1% |
| Immigrants | Africa | 2.7 /100 | #225 | Tragic 18.2% |
| Nicaraguans | 2.4 /100 | #226 | Tragic 18.2% |
| Immigrants | Nonimmigrants | 2.0 /100 | #227 | Tragic 18.3% |
Demographics Similar to Immigrants from Denmark by Child Poverty Among Girls Under 16
In terms of child poverty among girls under 16, the demographic groups most similar to Immigrants from Denmark are Immigrants from North Macedonia (15.2%, a difference of 0.090%), Immigrants from Southern Europe (15.3%, a difference of 0.28%), Belgian (15.2%, a difference of 0.31%), Sri Lankan (15.2%, a difference of 0.38%), and Immigrants from Zimbabwe (15.3%, a difference of 0.38%).
| Demographics | Rating | Rank | Child Poverty Among Girls Under 16 |
| Serbians | 94.8 /100 | #109 | Exceptional 15.1% |
| Immigrants | Croatia | 94.6 /100 | #110 | Exceptional 15.1% |
| Palestinians | 94.5 /100 | #111 | Exceptional 15.1% |
| Immigrants | Kazakhstan | 94.3 /100 | #112 | Exceptional 15.1% |
| Dutch | 94.3 /100 | #113 | Exceptional 15.1% |
| Sri Lankans | 94.0 /100 | #114 | Exceptional 15.2% |
| Belgians | 93.9 /100 | #115 | Exceptional 15.2% |
| Immigrants | Denmark | 93.3 /100 | #116 | Exceptional 15.2% |
| Immigrants | North Macedonia | 93.1 /100 | #117 | Exceptional 15.2% |
| Immigrants | Southern Europe | 92.7 /100 | #118 | Exceptional 15.3% |
| Immigrants | Zimbabwe | 92.5 /100 | #119 | Exceptional 15.3% |
| Pakistanis | 92.3 /100 | #120 | Exceptional 15.3% |
| English | 92.2 /100 | #121 | Exceptional 15.3% |
| Portuguese | 91.8 /100 | #122 | Exceptional 15.3% |
| Irish | 91.5 /100 | #123 | Exceptional 15.3% |