Lebanese vs Subsaharan African Child Poverty Among Girls Under 16

COMPARE

Lebanese
Race
Ancestry
AfghanAfricanAlaska NativeAlaskan AthabascanAlbanianAleutAlsatianAmericanApacheArabArapahoArgentineanArmenianAssyrian/Chaldean/SyriacAustralianAustrianBahamianBangladeshiBarbadianBasqueBelgianBelizeanBermudanBhutaneseBlackfeetBolivianBrazilianBritishBritish West IndianBulgarianBurmeseCajunCambodianCanadianCape VerdeanCarpatho RusynCelticCentral AmericanCentral American IndianCherokeeCheyenneChickasawChileanChineseChippewaChoctawColombianColvilleComancheCosta RicanCreeCreekCroatianCrowCubanCypriotCzechCzechoslovakianDanishDelawareDominicanDutchDutch West IndianEastern EuropeanEcuadorianEgyptianEnglishEstonianEthiopianEuropeanFijianFilipinoFinnishFrenchFrench American IndianFrench CanadianGermanGerman RussianGhanaianGreekGuamanian/ChamorroGuatemalanGuyaneseHaitianHmongHonduranHopiHoumaHungarianIcelanderIndian (Asian)IndonesianInupiatIranianIraqiIrishIroquoisIsraeliItalianJamaicanJapaneseJordanianKenyanKiowaKoreanLaotianLatvianLebaneseLiberianLithuanianLumbeeLuxembourgerMacedonianMalaysianMalteseMarshalleseMenomineeMexicanMexican American IndianMongolianMoroccanNative HawaiianNavajoNepaleseNew ZealanderNicaraguanNigerianNorthern EuropeanNorwegianOkinawanOsageOttawaPaiutePakistaniPalestinianPanamanianParaguayanPennsylvania GermanPeruvianPimaPolishPortuguesePotawatomiPuebloPuerto RicanPuget Sound SalishRomanianRussianSalvadoranSamoanScandinavianScotch-IrishScottishSeminoleSenegaleseSerbianShoshoneSierra LeoneanSiouxSlavicSlovakSloveneSomaliSouth AfricanSouth AmericanSouth American IndianSoviet UnionSpaniardSpanishSpanish AmericanSpanish American IndianSri LankanSudaneseSwedishSwissSyrianTaiwaneseThaiTlingit-HaidaTohono O'OdhamTonganTrinidadian and TobagonianTsimshianTurkishU.S. Virgin IslanderUgandanUkrainianUruguayanUteVenezuelanVietnameseWelshWest IndianYakamaYaquiYugoslavianYumanYup'ikZimbabwean
Immigration
NonimmigrantsImmigrantsAfghanistanAfricaAlbaniaArgentinaArmeniaAsiaAustraliaAustriaBahamasBangladeshBarbadosBelarusBelgiumBelizeBoliviaBosnia and HerzegovinaBrazilBulgariaBurma/MyanmarCabo VerdeCambodiaCameroonCanadaCaribbeanCentral AmericaChileChinaColombiaCongoCosta RicaCroatiaCubaCzechoslovakiaDenmarkDominicaDominican RepublicEastern AfricaEastern AsiaEastern EuropeEcuadorEgyptEl SalvadorEnglandEritreaEthiopiaEuropeFijiFranceGermanyGhanaGreeceGrenadaGuatemalaGuyanaHaitiHondurasHong KongHungaryIndiaIndonesiaIranIraqIrelandIsraelItalyJamaicaJapanJordanKazakhstanKenyaKoreaKuwaitLaosLatin AmericaLatviaLebanonLiberiaLithuaniaMalaysiaMexicoMicronesiaMiddle AfricaMoldovaMoroccoNepalNetherlandsNicaraguaNigeriaNorth AmericaNorth MacedoniaNorthern AfricaNorthern EuropeNorwayOceaniaPakistanPanamaPeruPhilippinesPolandPortugalRomaniaRussiaSaudi ArabiaScotlandSenegalSerbiaSierra LeoneSingaporeSomaliaSouth AfricaSouth AmericaSouth Central AsiaSouth Eastern AsiaSouthern EuropeSpainSri LankaSt. Vincent and the GrenadinesSudanSwedenSwitzerlandSyriaTaiwanThailandTrinidad and TobagoTurkeyUgandaUkraineUruguayUzbekistanVenezuelaVietnamWest IndiesWestern AfricaWestern AsiaWestern EuropeYemenZaireZimbabweAzores
Subsaharan African
Race
Ancestry
AfghanAfricanAlaska NativeAlaskan AthabascanAlbanianAleutAlsatianAmericanApacheArabArapahoArgentineanArmenianAssyrian/Chaldean/SyriacAustralianAustrianBahamianBangladeshiBarbadianBasqueBelgianBelizeanBermudanBhutaneseBlackfeetBolivianBrazilianBritishBritish West IndianBulgarianBurmeseCajunCambodianCanadianCape VerdeanCarpatho RusynCelticCentral AmericanCentral American IndianCherokeeCheyenneChickasawChileanChineseChippewaChoctawColombianColvilleComancheCosta RicanCreeCreekCroatianCrowCubanCypriotCzechCzechoslovakianDanishDelawareDominicanDutchDutch West IndianEastern EuropeanEcuadorianEgyptianEnglishEstonianEthiopianEuropeanFijianFilipinoFinnishFrenchFrench American IndianFrench CanadianGermanGerman RussianGhanaianGreekGuamanian/ChamorroGuatemalanGuyaneseHaitianHmongHonduranHopiHoumaHungarianIcelanderIndian (Asian)IndonesianInupiatIranianIraqiIrishIroquoisIsraeliItalianJamaicanJapaneseJordanianKenyanKiowaKoreanLaotianLatvianLiberianLithuanianLumbeeLuxembourgerMacedonianMalaysianMalteseMarshalleseMenomineeMexicanMexican American IndianMongolianMoroccanNative HawaiianNavajoNepaleseNew ZealanderNicaraguanNigerianNorthern EuropeanNorwegianOkinawanOsageOttawaPaiutePakistaniPalestinianPanamanianParaguayanPennsylvania GermanPeruvianPimaPolishPortuguesePotawatomiPuebloPuerto RicanPuget Sound SalishRomanianRussianSalvadoranSamoanScandinavianScotch-IrishScottishSeminoleSenegaleseSerbianShoshoneSierra LeoneanSiouxSlavicSlovakSloveneSomaliSouth AfricanSouth AmericanSouth American IndianSoviet UnionSpaniardSpanishSpanish AmericanSpanish American IndianSri LankanSubsaharan AfricanSudaneseSwedishSwissSyrianTaiwaneseThaiTlingit-HaidaTohono O'OdhamTonganTrinidadian and TobagonianTsimshianTurkishU.S. Virgin IslanderUgandanUkrainianUruguayanUteVenezuelanVietnameseWelshWest IndianYakamaYaquiYugoslavianYumanYup'ikZimbabwean
Immigration
NonimmigrantsImmigrantsAfghanistanAfricaAlbaniaArgentinaArmeniaAsiaAustraliaAustriaBahamasBangladeshBarbadosBelarusBelgiumBelizeBoliviaBosnia and HerzegovinaBrazilBulgariaBurma/MyanmarCabo VerdeCambodiaCameroonCanadaCaribbeanCentral AmericaChileChinaColombiaCongoCosta RicaCroatiaCubaCzechoslovakiaDenmarkDominicaDominican RepublicEastern AfricaEastern AsiaEastern EuropeEcuadorEgyptEl SalvadorEnglandEritreaEthiopiaEuropeFijiFranceGermanyGhanaGreeceGrenadaGuatemalaGuyanaHaitiHondurasHong KongHungaryIndiaIndonesiaIranIraqIrelandIsraelItalyJamaicaJapanJordanKazakhstanKenyaKoreaKuwaitLaosLatin AmericaLatviaLebanonLiberiaLithuaniaMalaysiaMexicoMicronesiaMiddle AfricaMoldovaMoroccoNepalNetherlandsNicaraguaNigeriaNorth AmericaNorth MacedoniaNorthern AfricaNorthern EuropeNorwayOceaniaPakistanPanamaPeruPhilippinesPolandPortugalRomaniaRussiaSaudi ArabiaScotlandSenegalSerbiaSierra LeoneSingaporeSomaliaSouth AfricaSouth AmericaSouth Central AsiaSouth Eastern AsiaSouthern EuropeSpainSri LankaSt. Vincent and the GrenadinesSudanSwedenSwitzerlandSyriaTaiwanThailandTrinidad and TobagoTurkeyUgandaUkraineUruguayUzbekistanVenezuelaVietnamWest IndiesWestern AfricaWestern AsiaWestern EuropeYemenZaireZimbabweAzores
Child Poverty Among Girls Under 16
Income
Poverty
Unemployment
Labor Participation
Family Structure
Vehicle Availability
Education Level
Disability

Child Poverty Among Girls Under 16 Comparison

Lebanese

Sub-Saharan Africans

Average
Tragic
16.6%
CHILD POVERTY AMONG GIRLS UNDER 16
45.4/ 100
METRIC RATING
175th/ 347
METRIC RANK
20.1%
CHILD POVERTY AMONG GIRLS UNDER 16
0.0/ 100
METRIC RATING
275th/ 347
METRIC RANK

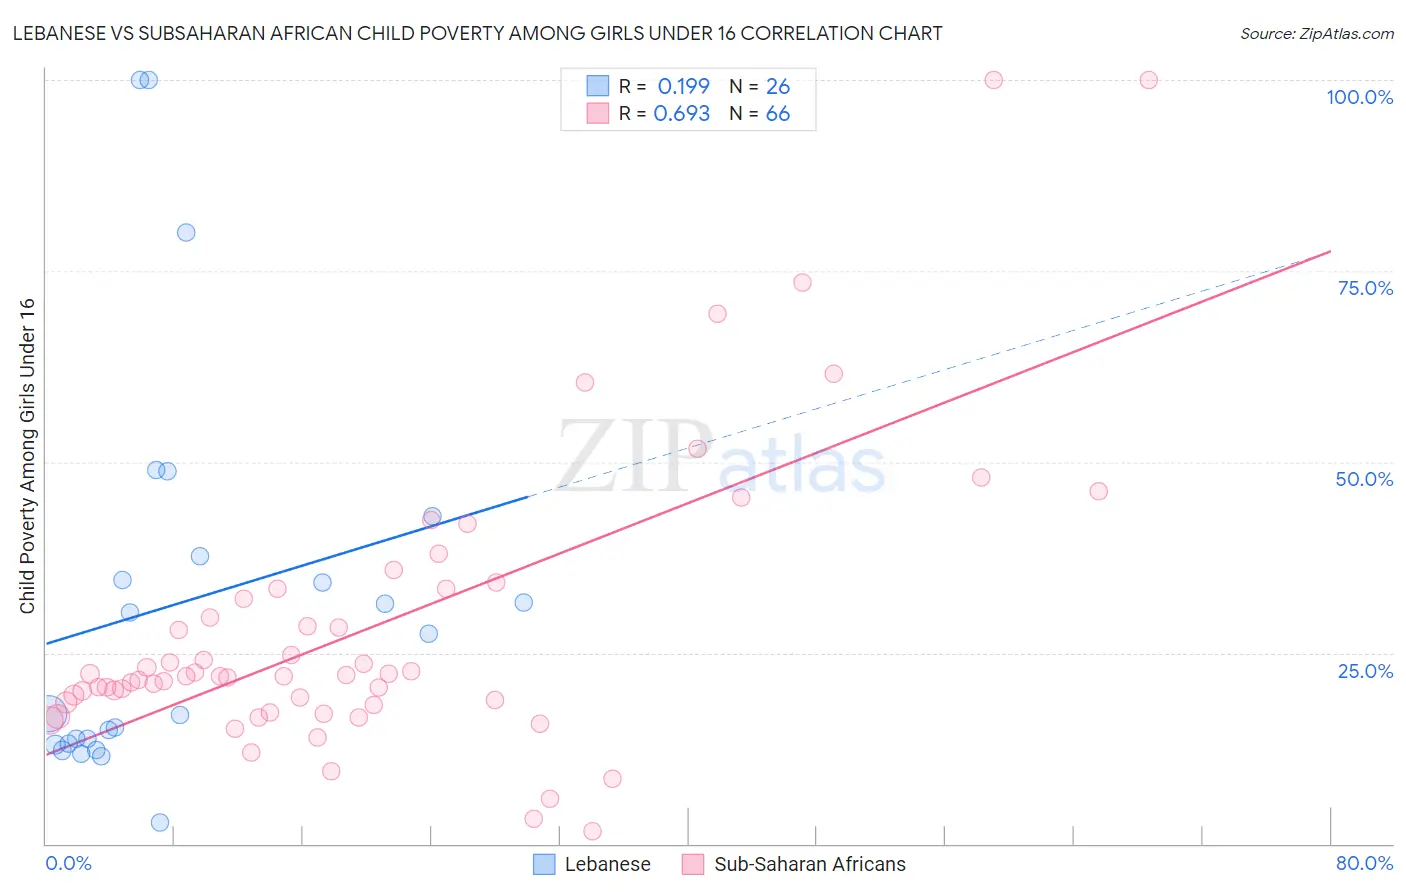
Lebanese vs Subsaharan African Child Poverty Among Girls Under 16 Correlation Chart

The statistical analysis conducted on geographies consisting of 392,919,578 people shows a poor positive correlation between the proportion of Lebanese and poverty level among girls under the age of 16 in the United States with a correlation coefficient (R) of 0.199 and weighted average of 16.6%. Similarly, the statistical analysis conducted on geographies consisting of 496,899,151 people shows a significant positive correlation between the proportion of Sub-Saharan Africans and poverty level among girls under the age of 16 in the United States with a correlation coefficient (R) of 0.693 and weighted average of 20.1%, a difference of 21.5%.
Lebanese vs Subsaharan African Child Poverty Among Girls Under 16

Child Poverty Among Girls Under 16 Correlation Summary

MeasurementLebaneseSubsaharan African
Minimum2.8%1.7%
Maximum100.0%100.0%
Range97.2%98.3%
Mean31.4%28.3%
Median22.3%21.9%
Interquartile 25% (IQ1)13.2%18.5%
Interquartile 75% (IQ3)37.7%33.3%
Interquartile Range (IQR)24.5%14.8%
Standard Deviation (Sample)26.2%19.2%
Standard Deviation (Population)25.7%19.1%

Similar Demographics by Child Poverty Among Girls Under 16

Demographics Similar to Lebanese by Child Poverty Among Girls Under 16

In terms of child poverty among girls under 16, the demographic groups most similar to Lebanese are Hungarian (16.6%, a difference of 0.030%), Immigrants from Western Asia (16.6%, a difference of 0.15%), White/Caucasian (16.6%, a difference of 0.20%), Hawaiian (16.6%, a difference of 0.23%), and Immigrants from Syria (16.6%, a difference of 0.24%).
DemographicsRating | RankChild Poverty Among Girls Under 16
Yugoslavians
64.4
/100
|
#168
Good
16.2%
Costa Ricans
64.2
/100
|
#169
Good
16.2%
Immigrants | Venezuela
64.2
/100
|
#170
Good
16.2%
Immigrants | Saudi Arabia
64.0
/100
|
#171
Good
16.2%
Afghans
62.3
/100
|
#172
Good
16.2%
Immigrants | South America
55.1
/100
|
#173
Average
16.4%
Ethiopians
50.0
/100
|
#174
Average
16.5%
Lebanese
45.4
/100
|
#175
Average
16.6%
Hungarians
45.1
/100
|
#176
Average
16.6%
Immigrants | Western Asia
44.1
/100
|
#177
Average
16.6%
Whites/Caucasians
43.6
/100
|
#178
Average
16.6%
Hawaiians
43.4
/100
|
#179
Average
16.6%
Immigrants | Syria
43.3
/100
|
#180
Average
16.6%
Immigrants | Iraq
43.2
/100
|
#181
Average
16.6%
Immigrants | Ethiopia
43.1
/100
|
#182
Average
16.6%

Demographics Similar to Sub-Saharan Africans by Child Poverty Among Girls Under 16

In terms of child poverty among girls under 16, the demographic groups most similar to Sub-Saharan Africans are Immigrants from St. Vincent and the Grenadines (20.1%, a difference of 0.14%), Comanche (20.2%, a difference of 0.32%), Belizean (20.2%, a difference of 0.43%), Barbadian (20.2%, a difference of 0.46%), and Bangladeshi (20.0%, a difference of 0.57%).
DemographicsRating | RankChild Poverty Among Girls Under 16
Spanish American Indians
0.1
/100
|
#268
Tragic
19.9%
Liberians
0.1
/100
|
#269
Tragic
19.9%
Cherokee
0.1
/100
|
#270
Tragic
19.9%
Immigrants | Barbados
0.1
/100
|
#271
Tragic
19.9%
Immigrants | El Salvador
0.1
/100
|
#272
Tragic
20.0%
Bangladeshis
0.1
/100
|
#273
Tragic
20.0%
Immigrants | St. Vincent and the Grenadines
0.0
/100
|
#274
Tragic
20.1%
Sub-Saharan Africans
0.0
/100
|
#275
Tragic
20.1%
Comanche
0.0
/100
|
#276
Tragic
20.2%
Belizeans
0.0
/100
|
#277
Tragic
20.2%
Barbadians
0.0
/100
|
#278
Tragic
20.2%
Immigrants | Zaire
0.0
/100
|
#279
Tragic
20.2%
Immigrants | Liberia
0.0
/100
|
#280
Tragic
20.2%
Central Americans
0.0
/100
|
#281
Tragic
20.2%
West Indians
0.0
/100
|
#282
Tragic
20.3%