Latvian vs Portuguese Female Poverty

COMPARE

Latvian
Race
Ancestry
AfghanAfricanAlaska NativeAlaskan AthabascanAlbanianAleutAlsatianAmericanApacheArabArapahoArgentineanArmenianAssyrian/Chaldean/SyriacAustralianAustrianBahamianBangladeshiBarbadianBasqueBelgianBelizeanBermudanBhutaneseBlackfeetBolivianBrazilianBritishBritish West IndianBulgarianBurmeseCajunCambodianCanadianCape VerdeanCarpatho RusynCelticCentral AmericanCentral American IndianCherokeeCheyenneChickasawChileanChineseChippewaChoctawColombianColvilleComancheCosta RicanCreeCreekCroatianCrowCubanCypriotCzechCzechoslovakianDanishDelawareDominicanDutchDutch West IndianEastern EuropeanEcuadorianEgyptianEnglishEstonianEthiopianEuropeanFijianFilipinoFinnishFrenchFrench American IndianFrench CanadianGermanGerman RussianGhanaianGreekGuamanian/ChamorroGuatemalanGuyaneseHaitianHmongHonduranHopiHoumaHungarianIcelanderIndian (Asian)IndonesianInupiatIranianIraqiIrishIroquoisIsraeliItalianJamaicanJapaneseJordanianKenyanKiowaKoreanLaotianLatvianLebaneseLiberianLithuanianLumbeeLuxembourgerMacedonianMalaysianMalteseMarshalleseMenomineeMexicanMexican American IndianMongolianMoroccanNative HawaiianNavajoNepaleseNew ZealanderNicaraguanNigerianNorthern EuropeanNorwegianOkinawanOsageOttawaPaiutePakistaniPalestinianPanamanianParaguayanPennsylvania GermanPeruvianPimaPolishPotawatomiPuebloPuerto RicanPuget Sound SalishRomanianRussianSalvadoranSamoanScandinavianScotch-IrishScottishSeminoleSenegaleseSerbianShoshoneSierra LeoneanSiouxSlavicSlovakSloveneSomaliSouth AfricanSouth AmericanSouth American IndianSoviet UnionSpaniardSpanishSpanish AmericanSpanish American IndianSri LankanSubsaharan AfricanSudaneseSwedishSwissSyrianTaiwaneseThaiTlingit-HaidaTohono O'OdhamTonganTrinidadian and TobagonianTsimshianTurkishU.S. Virgin IslanderUgandanUkrainianUruguayanUteVenezuelanVietnameseWelshWest IndianYakamaYaquiYugoslavianYumanYup'ikZimbabwean
Immigration
NonimmigrantsImmigrantsAfghanistanAfricaAlbaniaArgentinaArmeniaAsiaAustraliaAustriaBahamasBangladeshBarbadosBelarusBelgiumBelizeBoliviaBosnia and HerzegovinaBrazilBulgariaBurma/MyanmarCabo VerdeCambodiaCameroonCanadaCaribbeanCentral AmericaChileChinaColombiaCongoCosta RicaCroatiaCubaCzechoslovakiaDenmarkDominicaDominican RepublicEastern AfricaEastern AsiaEastern EuropeEcuadorEgyptEl SalvadorEnglandEritreaEthiopiaEuropeFijiFranceGermanyGhanaGreeceGrenadaGuatemalaGuyanaHaitiHondurasHong KongHungaryIndiaIndonesiaIranIraqIrelandIsraelItalyJamaicaJapanJordanKazakhstanKenyaKoreaKuwaitLaosLatin AmericaLatviaLebanonLiberiaLithuaniaMalaysiaMexicoMicronesiaMiddle AfricaMoldovaMoroccoNepalNetherlandsNicaraguaNigeriaNorth AmericaNorth MacedoniaNorthern AfricaNorthern EuropeNorwayOceaniaPakistanPanamaPeruPhilippinesPolandPortugalRomaniaRussiaSaudi ArabiaScotlandSenegalSerbiaSierra LeoneSingaporeSomaliaSouth AfricaSouth AmericaSouth Central AsiaSouth Eastern AsiaSouthern EuropeSpainSri LankaSt. Vincent and the GrenadinesSudanSwedenSwitzerlandSyriaTaiwanThailandTrinidad and TobagoTurkeyUgandaUkraineUruguayUzbekistanVenezuelaVietnamWest IndiesWestern AfricaWestern AsiaWestern EuropeYemenZaireZimbabweAzores
Portuguese
Race
Ancestry
AfghanAfricanAlaska NativeAlaskan AthabascanAlbanianAleutAlsatianAmericanApacheArabArapahoArgentineanArmenianAssyrian/Chaldean/SyriacAustralianAustrianBahamianBangladeshiBarbadianBasqueBelgianBelizeanBermudanBhutaneseBlackfeetBolivianBrazilianBritishBritish West IndianBulgarianBurmeseCajunCambodianCanadianCape VerdeanCarpatho RusynCelticCentral AmericanCentral American IndianCherokeeCheyenneChickasawChileanChineseChippewaChoctawColombianColvilleComancheCosta RicanCreeCreekCroatianCrowCubanCypriotCzechCzechoslovakianDanishDelawareDominicanDutchDutch West IndianEastern EuropeanEcuadorianEgyptianEnglishEstonianEthiopianEuropeanFijianFilipinoFinnishFrenchFrench American IndianFrench CanadianGermanGerman RussianGhanaianGreekGuamanian/ChamorroGuatemalanGuyaneseHaitianHmongHonduranHopiHoumaHungarianIcelanderIndian (Asian)IndonesianInupiatIranianIraqiIrishIroquoisIsraeliItalianJamaicanJapaneseJordanianKenyanKiowaKoreanLaotianLebaneseLiberianLithuanianLumbeeLuxembourgerMacedonianMalaysianMalteseMarshalleseMenomineeMexicanMexican American IndianMongolianMoroccanNative HawaiianNavajoNepaleseNew ZealanderNicaraguanNigerianNorthern EuropeanNorwegianOkinawanOsageOttawaPaiutePakistaniPalestinianPanamanianParaguayanPennsylvania GermanPeruvianPimaPolishPortuguesePotawatomiPuebloPuerto RicanPuget Sound SalishRomanianRussianSalvadoranSamoanScandinavianScotch-IrishScottishSeminoleSenegaleseSerbianShoshoneSierra LeoneanSiouxSlavicSlovakSloveneSomaliSouth AfricanSouth AmericanSouth American IndianSoviet UnionSpaniardSpanishSpanish AmericanSpanish American IndianSri LankanSubsaharan AfricanSudaneseSwedishSwissSyrianTaiwaneseThaiTlingit-HaidaTohono O'OdhamTonganTrinidadian and TobagonianTsimshianTurkishU.S. Virgin IslanderUgandanUkrainianUruguayanUteVenezuelanVietnameseWelshWest IndianYakamaYaquiYugoslavianYumanYup'ikZimbabwean
Immigration
NonimmigrantsImmigrantsAfghanistanAfricaAlbaniaArgentinaArmeniaAsiaAustraliaAustriaBahamasBangladeshBarbadosBelarusBelgiumBelizeBoliviaBosnia and HerzegovinaBrazilBulgariaBurma/MyanmarCabo VerdeCambodiaCameroonCanadaCaribbeanCentral AmericaChileChinaColombiaCongoCosta RicaCroatiaCubaCzechoslovakiaDenmarkDominicaDominican RepublicEastern AfricaEastern AsiaEastern EuropeEcuadorEgyptEl SalvadorEnglandEritreaEthiopiaEuropeFijiFranceGermanyGhanaGreeceGrenadaGuatemalaGuyanaHaitiHondurasHong KongHungaryIndiaIndonesiaIranIraqIrelandIsraelItalyJamaicaJapanJordanKazakhstanKenyaKoreaKuwaitLaosLatin AmericaLatviaLebanonLiberiaLithuaniaMalaysiaMexicoMicronesiaMiddle AfricaMoldovaMoroccoNepalNetherlandsNicaraguaNigeriaNorth AmericaNorth MacedoniaNorthern AfricaNorthern EuropeNorwayOceaniaPakistanPanamaPeruPhilippinesPolandPortugalRomaniaRussiaSaudi ArabiaScotlandSenegalSerbiaSierra LeoneSingaporeSomaliaSouth AfricaSouth AmericaSouth Central AsiaSouth Eastern AsiaSouthern EuropeSpainSri LankaSt. Vincent and the GrenadinesSudanSwedenSwitzerlandSyriaTaiwanThailandTrinidad and TobagoTurkeyUgandaUkraineUruguayUzbekistanVenezuelaVietnamWest IndiesWestern AfricaWestern AsiaWestern EuropeYemenZaireZimbabweAzores
Female Poverty
Income
Poverty
Unemployment
Labor Participation
Family Structure
Vehicle Availability
Education Level
Disability

Female Poverty Comparison

Latvians

Portuguese

Exceptional
Exceptional
11.4%
FEMALE POVERTY
99.8/ 100
METRIC RATING
15th/ 347
METRIC RANK
12.6%
FEMALE POVERTY
93.1/ 100
METRIC RATING
108th/ 347
METRIC RANK

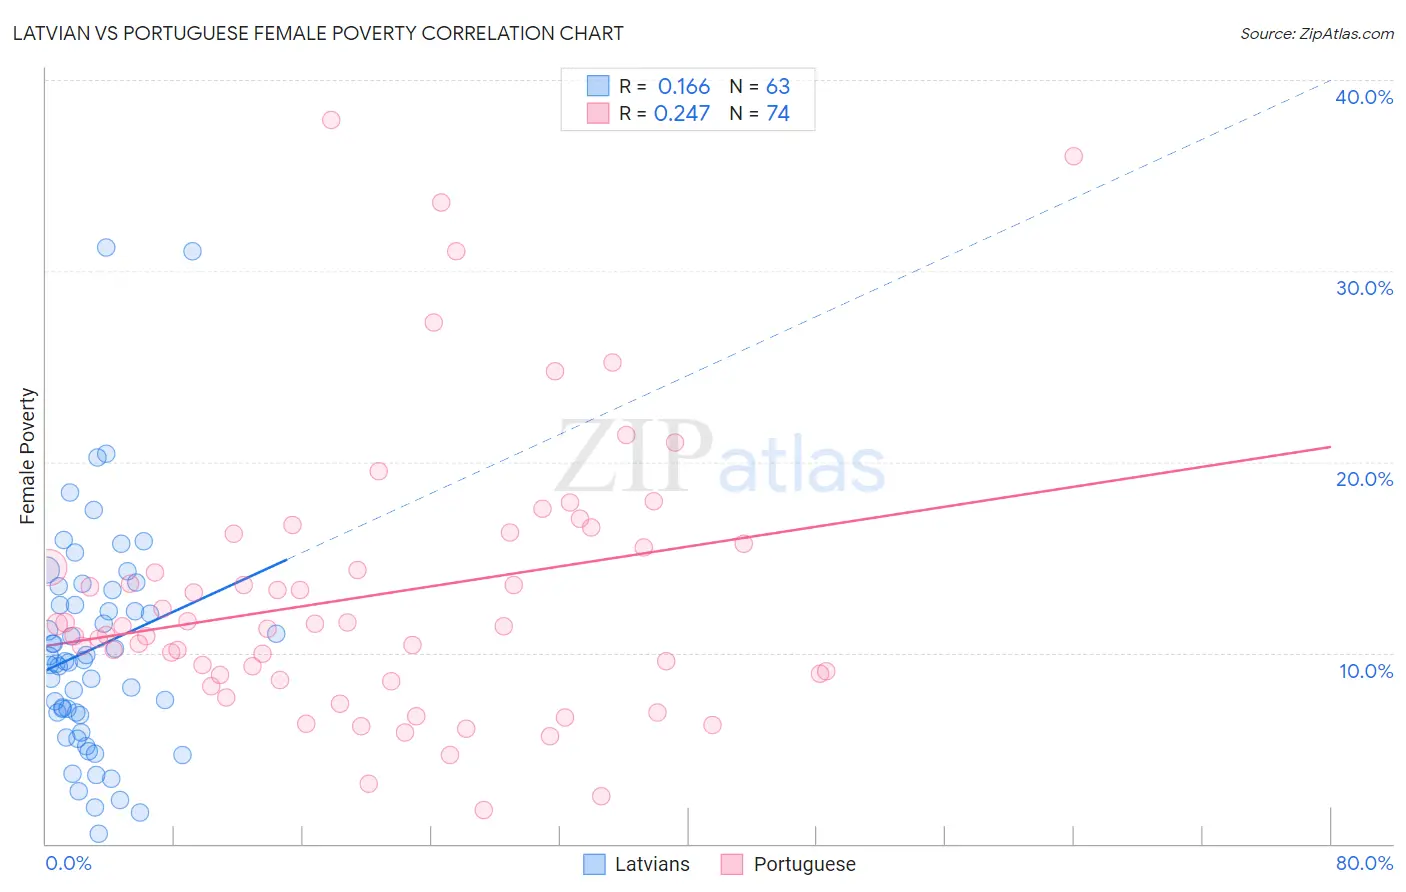
Latvian vs Portuguese Female Poverty Correlation Chart

The statistical analysis conducted on geographies consisting of 220,618,449 people shows a poor positive correlation between the proportion of Latvians and poverty level among females in the United States with a correlation coefficient (R) of 0.166 and weighted average of 11.4%. Similarly, the statistical analysis conducted on geographies consisting of 449,805,849 people shows a weak positive correlation between the proportion of Portuguese and poverty level among females in the United States with a correlation coefficient (R) of 0.247 and weighted average of 12.6%, a difference of 10.2%.
Latvian vs Portuguese Female Poverty

Female Poverty Correlation Summary

MeasurementLatvianPortuguese
Minimum0.50%1.8%
Maximum31.3%37.9%
Range30.8%36.1%
Mean10.2%13.0%
Median9.6%11.4%
Interquartile 25% (IQ1)6.7%8.8%
Interquartile 75% (IQ3)13.3%15.7%
Interquartile Range (IQR)6.5%6.9%
Standard Deviation (Sample)5.9%7.2%
Standard Deviation (Population)5.9%7.2%

Similar Demographics by Female Poverty

Demographics Similar to Latvians by Female Poverty

In terms of female poverty, the demographic groups most similar to Latvians are Lithuanian (11.4%, a difference of 0.32%), Immigrants from Bolivia (11.5%, a difference of 0.47%), Bolivian (11.5%, a difference of 0.54%), Immigrants from Scotland (11.5%, a difference of 0.59%), and Norwegian (11.5%, a difference of 0.64%).
DemographicsRating | RankFemale Poverty
Immigrants | South Central Asia
99.9
/100
|
#8
Exceptional
11.1%
Bulgarians
99.9
/100
|
#9
Exceptional
11.1%
Immigrants | Hong Kong
99.9
/100
|
#10
Exceptional
11.2%
Maltese
99.9
/100
|
#11
Exceptional
11.2%
Bhutanese
99.9
/100
|
#12
Exceptional
11.3%
Immigrants | Lithuania
99.9
/100
|
#13
Exceptional
11.3%
Lithuanians
99.8
/100
|
#14
Exceptional
11.4%
Latvians
99.8
/100
|
#15
Exceptional
11.4%
Immigrants | Bolivia
99.8
/100
|
#16
Exceptional
11.5%
Bolivians
99.8
/100
|
#17
Exceptional
11.5%
Immigrants | Scotland
99.8
/100
|
#18
Exceptional
11.5%
Norwegians
99.8
/100
|
#19
Exceptional
11.5%
Eastern Europeans
99.7
/100
|
#20
Exceptional
11.5%
Italians
99.7
/100
|
#21
Exceptional
11.6%
Swedes
99.7
/100
|
#22
Exceptional
11.6%

Demographics Similar to Portuguese by Female Poverty

In terms of female poverty, the demographic groups most similar to Portuguese are Immigrants from Zimbabwe (12.6%, a difference of 0.020%), Paraguayan (12.6%, a difference of 0.040%), Laotian (12.6%, a difference of 0.10%), Soviet Union (12.6%, a difference of 0.27%), and Immigrants from Turkey (12.6%, a difference of 0.29%).
DemographicsRating | RankFemale Poverty
Tlingit-Haida
94.8
/100
|
#101
Exceptional
12.5%
Immigrants | China
94.5
/100
|
#102
Exceptional
12.5%
Slavs
94.5
/100
|
#103
Exceptional
12.5%
Palestinians
94.3
/100
|
#104
Exceptional
12.5%
Scottish
94.1
/100
|
#105
Exceptional
12.5%
Immigrants | Turkey
93.8
/100
|
#106
Exceptional
12.6%
Laotians
93.4
/100
|
#107
Exceptional
12.6%
Portuguese
93.1
/100
|
#108
Exceptional
12.6%
Immigrants | Zimbabwe
93.1
/100
|
#109
Exceptional
12.6%
Paraguayans
93.0
/100
|
#110
Exceptional
12.6%
Soviet Union
92.4
/100
|
#111
Exceptional
12.6%
Immigrants | Israel
92.0
/100
|
#112
Exceptional
12.6%
Canadians
92.0
/100
|
#113
Exceptional
12.7%
Welsh
91.6
/100
|
#114
Exceptional
12.7%
Puget Sound Salish
91.5
/100
|
#115
Exceptional
12.7%