Indonesian vs Immigrants from Latin America Seniors Poverty Over the Age of 75
COMPARE
Indonesian
Immigrants from Latin America
Seniors Poverty Over the Age of 75
Seniors Poverty Over the Age of 75 Comparison
Indonesians
Immigrants from Latin America
12.1%
SENIORS POVERTY OVER THE AGE OF 75
62.6/ 100
METRIC RATING
155th/ 347
METRIC RANK
15.6%
SENIORS POVERTY OVER THE AGE OF 75
0.0/ 100
METRIC RATING
301st/ 347
METRIC RANK
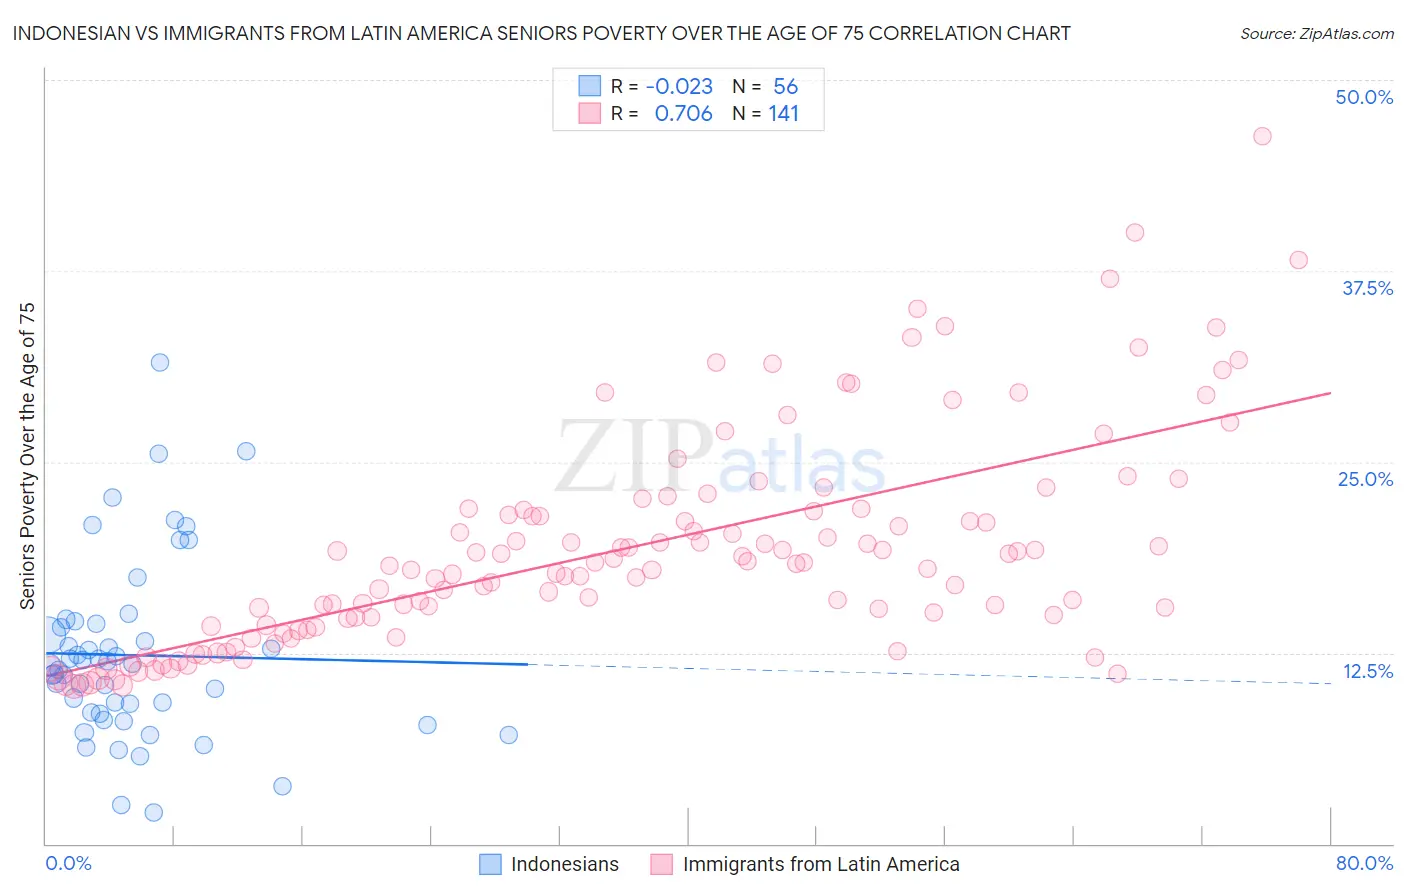
Indonesian vs Immigrants from Latin America Seniors Poverty Over the Age of 75 Correlation Chart
The statistical analysis conducted on geographies consisting of 161,954,632 people shows no correlation between the proportion of Indonesians and poverty level among seniors over the age of 75 in the United States with a correlation coefficient (R) of -0.023 and weighted average of 12.1%. Similarly, the statistical analysis conducted on geographies consisting of 544,282,449 people shows a strong positive correlation between the proportion of Immigrants from Latin America and poverty level among seniors over the age of 75 in the United States with a correlation coefficient (R) of 0.706 and weighted average of 15.6%, a difference of 29.6%.
Seniors Poverty Over the Age of 75 Correlation Summary
| Measurement | Indonesian | Immigrants from Latin America |
| Minimum | 2.1% | 10.3% |
| Maximum | 31.5% | 46.3% |
| Range | 29.5% | 36.0% |
| Mean | 12.3% | 19.3% |
| Median | 11.8% | 18.2% |
| Interquartile 25% (IQ1) | 8.6% | 14.2% |
| Interquartile 75% (IQ3) | 14.3% | 21.8% |
| Interquartile Range (IQR) | 5.7% | 7.6% |
| Standard Deviation (Sample) | 5.8% | 7.0% |
| Standard Deviation (Population) | 5.8% | 7.0% |
Similar Demographics by Seniors Poverty Over the Age of 75
Demographics Similar to Indonesians by Seniors Poverty Over the Age of 75
In terms of seniors poverty over the age of 75, the demographic groups most similar to Indonesians are Immigrants from Burma/Myanmar (12.1%, a difference of 0.020%), Immigrants from Sudan (12.1%, a difference of 0.080%), Cambodian (12.0%, a difference of 0.12%), Portuguese (12.1%, a difference of 0.12%), and Immigrants from Middle Africa (12.1%, a difference of 0.12%).
| Demographics | Rating | Rank | Seniors Poverty Over the Age of 75 |
| Immigrants | Zaire | 67.6 /100 | #148 | Good 12.0% |
| Asians | 67.4 /100 | #149 | Good 12.0% |
| Cypriots | 67.3 /100 | #150 | Good 12.0% |
| Cherokee | 65.8 /100 | #151 | Good 12.0% |
| Immigrants | Korea | 65.5 /100 | #152 | Good 12.0% |
| Immigrants | Turkey | 64.7 /100 | #153 | Good 12.0% |
| Cambodians | 64.0 /100 | #154 | Good 12.0% |
| Indonesians | 62.6 /100 | #155 | Good 12.1% |
| Immigrants | Burma/Myanmar | 62.3 /100 | #156 | Good 12.1% |
| Immigrants | Sudan | 61.7 /100 | #157 | Good 12.1% |
| Portuguese | 61.3 /100 | #158 | Good 12.1% |
| Immigrants | Middle Africa | 61.2 /100 | #159 | Good 12.1% |
| Immigrants | Eastern Africa | 60.9 /100 | #160 | Good 12.1% |
| Immigrants | Norway | 60.6 /100 | #161 | Good 12.1% |
| Immigrants | Serbia | 60.2 /100 | #162 | Good 12.1% |
Demographics Similar to Immigrants from Latin America by Seniors Poverty Over the Age of 75
In terms of seniors poverty over the age of 75, the demographic groups most similar to Immigrants from Latin America are West Indian (15.7%, a difference of 0.31%), Immigrants from Honduras (15.7%, a difference of 0.48%), Immigrants from Trinidad and Tobago (15.7%, a difference of 0.66%), Ecuadorian (15.7%, a difference of 0.70%), and Bahamian (15.5%, a difference of 0.78%).
| Demographics | Rating | Rank | Seniors Poverty Over the Age of 75 |
| Immigrants | Jamaica | 0.0 /100 | #294 | Tragic 15.3% |
| U.S. Virgin Islanders | 0.0 /100 | #295 | Tragic 15.4% |
| Yuman | 0.0 /100 | #296 | Tragic 15.4% |
| Hondurans | 0.0 /100 | #297 | Tragic 15.4% |
| Natives/Alaskans | 0.0 /100 | #298 | Tragic 15.5% |
| Spanish American Indians | 0.0 /100 | #299 | Tragic 15.5% |
| Bahamians | 0.0 /100 | #300 | Tragic 15.5% |
| Immigrants | Latin America | 0.0 /100 | #301 | Tragic 15.6% |
| West Indians | 0.0 /100 | #302 | Tragic 15.7% |
| Immigrants | Honduras | 0.0 /100 | #303 | Tragic 15.7% |
| Immigrants | Trinidad and Tobago | 0.0 /100 | #304 | Tragic 15.7% |
| Ecuadorians | 0.0 /100 | #305 | Tragic 15.7% |
| Hispanics or Latinos | 0.0 /100 | #306 | Tragic 15.8% |
| Immigrants | West Indies | 0.0 /100 | #307 | Tragic 15.8% |
| Immigrants | Bangladesh | 0.0 /100 | #308 | Tragic 15.8% |