Cambodian vs Immigrants from Latin America Seniors Poverty Over the Age of 75

COMPARE

Cambodian
Race
Ancestry
AfghanAfricanAlaska NativeAlaskan AthabascanAlbanianAleutAlsatianAmericanApacheArabArapahoArgentineanArmenianAssyrian/Chaldean/SyriacAustralianAustrianBahamianBangladeshiBarbadianBasqueBelgianBelizeanBermudanBhutaneseBlackfeetBolivianBrazilianBritishBritish West IndianBulgarianBurmeseCajunCambodianCanadianCape VerdeanCarpatho RusynCelticCentral AmericanCentral American IndianCherokeeCheyenneChickasawChileanChineseChippewaChoctawColombianColvilleComancheCosta RicanCreeCreekCroatianCrowCubanCypriotCzechCzechoslovakianDanishDelawareDominicanDutchDutch West IndianEastern EuropeanEcuadorianEgyptianEnglishEstonianEthiopianEuropeanFijianFilipinoFinnishFrenchFrench American IndianFrench CanadianGermanGerman RussianGhanaianGreekGuamanian/ChamorroGuatemalanGuyaneseHaitianHmongHonduranHopiHoumaHungarianIcelanderIndian (Asian)IndonesianInupiatIranianIraqiIrishIroquoisIsraeliItalianJamaicanJapaneseJordanianKenyanKiowaKoreanLaotianLatvianLebaneseLiberianLithuanianLumbeeLuxembourgerMacedonianMalaysianMalteseMarshalleseMenomineeMexicanMexican American IndianMongolianMoroccanNative HawaiianNavajoNepaleseNew ZealanderNicaraguanNigerianNorthern EuropeanNorwegianOkinawanOsageOttawaPaiutePakistaniPalestinianPanamanianParaguayanPennsylvania GermanPeruvianPimaPolishPortuguesePotawatomiPuebloPuerto RicanPuget Sound SalishRomanianRussianSalvadoranSamoanScandinavianScotch-IrishScottishSeminoleSenegaleseSerbianShoshoneSierra LeoneanSiouxSlavicSlovakSloveneSomaliSouth AfricanSouth AmericanSouth American IndianSoviet UnionSpaniardSpanishSpanish AmericanSpanish American IndianSri LankanSubsaharan AfricanSudaneseSwedishSwissSyrianTaiwaneseThaiTlingit-HaidaTohono O'OdhamTonganTrinidadian and TobagonianTsimshianTurkishU.S. Virgin IslanderUgandanUkrainianUruguayanUteVenezuelanVietnameseWelshWest IndianYakamaYaquiYugoslavianYumanYup'ikZimbabwean
Immigration
NonimmigrantsImmigrantsAfghanistanAfricaAlbaniaArgentinaArmeniaAsiaAustraliaAustriaBahamasBangladeshBarbadosBelarusBelgiumBelizeBoliviaBosnia and HerzegovinaBrazilBulgariaBurma/MyanmarCabo VerdeCambodiaCameroonCanadaCaribbeanCentral AmericaChileChinaColombiaCongoCosta RicaCroatiaCubaCzechoslovakiaDenmarkDominicaDominican RepublicEastern AfricaEastern AsiaEastern EuropeEcuadorEgyptEl SalvadorEnglandEritreaEthiopiaEuropeFijiFranceGermanyGhanaGreeceGrenadaGuatemalaGuyanaHaitiHondurasHong KongHungaryIndiaIndonesiaIranIraqIrelandIsraelItalyJamaicaJapanJordanKazakhstanKenyaKoreaKuwaitLaosLatviaLebanonLiberiaLithuaniaMalaysiaMexicoMicronesiaMiddle AfricaMoldovaMoroccoNepalNetherlandsNicaraguaNigeriaNorth AmericaNorth MacedoniaNorthern AfricaNorthern EuropeNorwayOceaniaPakistanPanamaPeruPhilippinesPolandPortugalRomaniaRussiaSaudi ArabiaScotlandSenegalSerbiaSierra LeoneSingaporeSomaliaSouth AfricaSouth AmericaSouth Central AsiaSouth Eastern AsiaSouthern EuropeSpainSri LankaSt. Vincent and the GrenadinesSudanSwedenSwitzerlandSyriaTaiwanThailandTrinidad and TobagoTurkeyUgandaUkraineUruguayUzbekistanVenezuelaVietnamWest IndiesWestern AfricaWestern AsiaWestern EuropeYemenZaireZimbabweAzores
Immigrants from Latin America
Race
Ancestry
AfghanAfricanAlaska NativeAlaskan AthabascanAlbanianAleutAlsatianAmericanApacheArabArapahoArgentineanArmenianAssyrian/Chaldean/SyriacAustralianAustrianBahamianBangladeshiBarbadianBasqueBelgianBelizeanBermudanBhutaneseBlackfeetBolivianBrazilianBritishBritish West IndianBulgarianBurmeseCajunCanadianCape VerdeanCarpatho RusynCelticCentral AmericanCentral American IndianCherokeeCheyenneChickasawChileanChineseChippewaChoctawColombianColvilleComancheCosta RicanCreeCreekCroatianCrowCubanCypriotCzechCzechoslovakianDanishDelawareDominicanDutchDutch West IndianEastern EuropeanEcuadorianEgyptianEnglishEstonianEthiopianEuropeanFijianFilipinoFinnishFrenchFrench American IndianFrench CanadianGermanGerman RussianGhanaianGreekGuamanian/ChamorroGuatemalanGuyaneseHaitianHmongHonduranHopiHoumaHungarianIcelanderIndian (Asian)IndonesianInupiatIranianIraqiIrishIroquoisIsraeliItalianJamaicanJapaneseJordanianKenyanKiowaKoreanLaotianLatvianLebaneseLiberianLithuanianLumbeeLuxembourgerMacedonianMalaysianMalteseMarshalleseMenomineeMexicanMexican American IndianMongolianMoroccanNative HawaiianNavajoNepaleseNew ZealanderNicaraguanNigerianNorthern EuropeanNorwegianOkinawanOsageOttawaPaiutePakistaniPalestinianPanamanianParaguayanPennsylvania GermanPeruvianPimaPolishPortuguesePotawatomiPuebloPuerto RicanPuget Sound SalishRomanianRussianSalvadoranSamoanScandinavianScotch-IrishScottishSeminoleSenegaleseSerbianShoshoneSierra LeoneanSiouxSlavicSlovakSloveneSomaliSouth AfricanSouth AmericanSouth American IndianSoviet UnionSpaniardSpanishSpanish AmericanSpanish American IndianSri LankanSubsaharan AfricanSudaneseSwedishSwissSyrianTaiwaneseThaiTlingit-HaidaTohono O'OdhamTonganTrinidadian and TobagonianTsimshianTurkishU.S. Virgin IslanderUgandanUkrainianUruguayanUteVenezuelanVietnameseWelshWest IndianYakamaYaquiYugoslavianYumanYup'ikZimbabwean
Immigration
NonimmigrantsImmigrantsAfghanistanAfricaAlbaniaArgentinaArmeniaAsiaAustraliaAustriaBahamasBangladeshBarbadosBelarusBelgiumBelizeBoliviaBosnia and HerzegovinaBrazilBulgariaBurma/MyanmarCabo VerdeCambodiaCameroonCanadaCaribbeanCentral AmericaChileChinaColombiaCongoCosta RicaCroatiaCubaCzechoslovakiaDenmarkDominicaDominican RepublicEastern AfricaEastern AsiaEastern EuropeEcuadorEgyptEl SalvadorEnglandEritreaEthiopiaEuropeFijiFranceGermanyGhanaGreeceGrenadaGuatemalaGuyanaHaitiHondurasHong KongHungaryIndiaIndonesiaIranIraqIrelandIsraelItalyJamaicaJapanJordanKazakhstanKenyaKoreaKuwaitLaosLatin AmericaLatviaLebanonLiberiaLithuaniaMalaysiaMexicoMicronesiaMiddle AfricaMoldovaMoroccoNepalNetherlandsNicaraguaNigeriaNorth AmericaNorth MacedoniaNorthern AfricaNorthern EuropeNorwayOceaniaPakistanPanamaPeruPhilippinesPolandPortugalRomaniaRussiaSaudi ArabiaScotlandSenegalSerbiaSierra LeoneSingaporeSomaliaSouth AfricaSouth AmericaSouth Central AsiaSouth Eastern AsiaSouthern EuropeSpainSri LankaSt. Vincent and the GrenadinesSudanSwedenSwitzerlandSyriaTaiwanThailandTrinidad and TobagoTurkeyUgandaUkraineUruguayUzbekistanVenezuelaVietnamWest IndiesWestern AfricaWestern AsiaWestern EuropeYemenZaireZimbabweAzores
Seniors Poverty Over the Age of 75
Income
Poverty
Unemployment
Labor Participation
Family Structure
Vehicle Availability
Education Level
Disability

Seniors Poverty Over the Age of 75 Comparison

Cambodians

Immigrants from Latin America

Good
Tragic
12.0%
SENIORS POVERTY OVER THE AGE OF 75
64.0/ 100
METRIC RATING
154th/ 347
METRIC RANK
15.6%
SENIORS POVERTY OVER THE AGE OF 75
0.0/ 100
METRIC RATING
301st/ 347
METRIC RANK

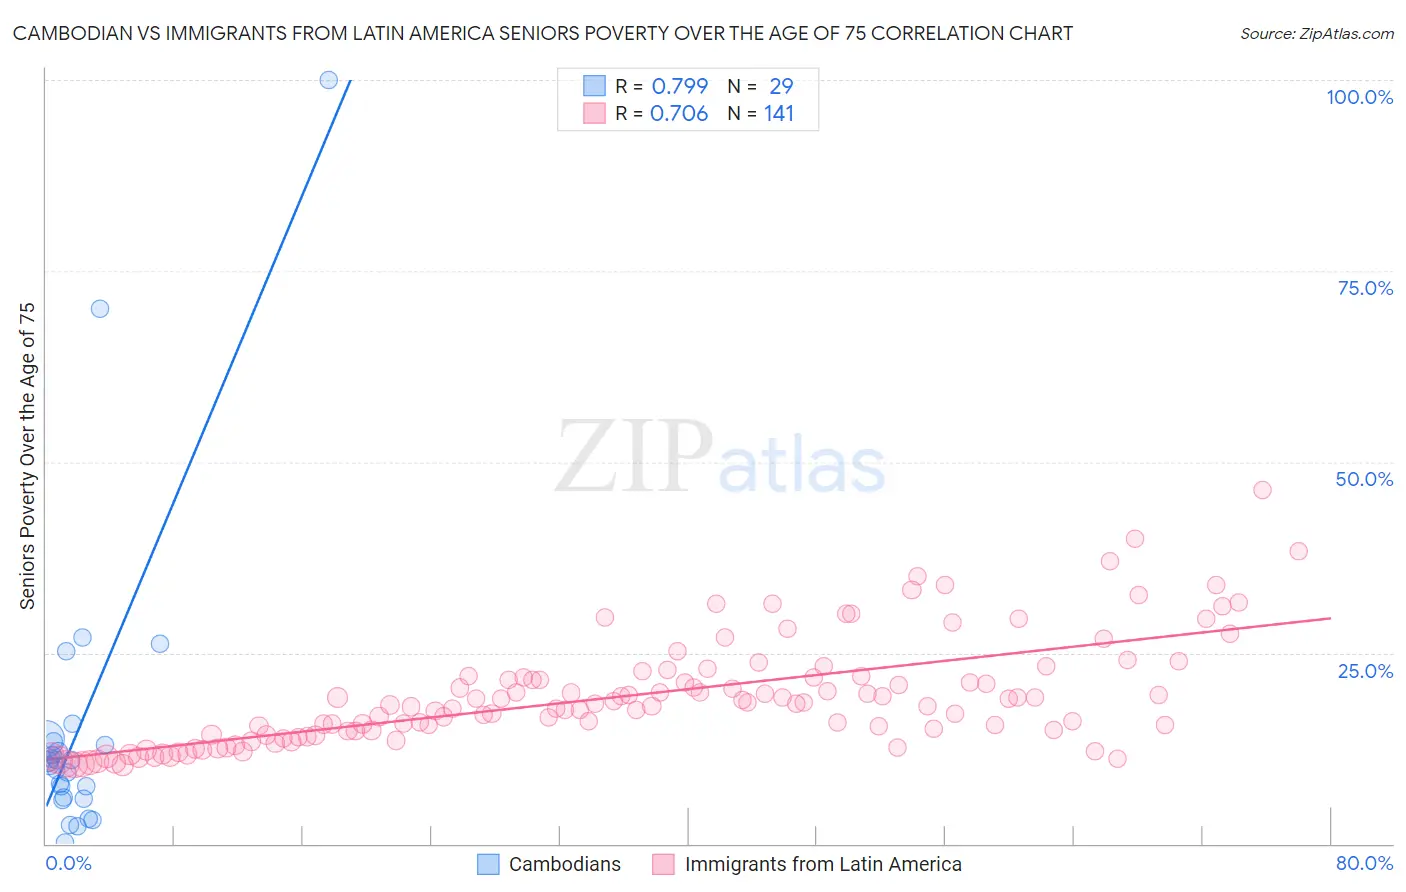
Cambodian vs Immigrants from Latin America Seniors Poverty Over the Age of 75 Correlation Chart

The statistical analysis conducted on geographies consisting of 102,059,315 people shows a strong positive correlation between the proportion of Cambodians and poverty level among seniors over the age of 75 in the United States with a correlation coefficient (R) of 0.799 and weighted average of 12.0%. Similarly, the statistical analysis conducted on geographies consisting of 544,282,449 people shows a strong positive correlation between the proportion of Immigrants from Latin America and poverty level among seniors over the age of 75 in the United States with a correlation coefficient (R) of 0.706 and weighted average of 15.6%, a difference of 29.8%.
Cambodian vs Immigrants from Latin America Seniors Poverty Over the Age of 75

Seniors Poverty Over the Age of 75 Correlation Summary

MeasurementCambodianImmigrants from Latin America
Minimum0.12%10.3%
Maximum100.0%46.3%
Range99.9%36.0%
Mean15.6%19.3%
Median10.7%18.2%
Interquartile 25% (IQ1)6.0%14.2%
Interquartile 75% (IQ3)13.6%21.8%
Interquartile Range (IQR)7.5%7.6%
Standard Deviation (Sample)20.7%7.0%
Standard Deviation (Population)20.4%7.0%

Similar Demographics by Seniors Poverty Over the Age of 75

Demographics Similar to Cambodians by Seniors Poverty Over the Age of 75

In terms of seniors poverty over the age of 75, the demographic groups most similar to Cambodians are Immigrants from Turkey (12.0%, a difference of 0.060%), Indonesian (12.1%, a difference of 0.12%), Immigrants from Korea (12.0%, a difference of 0.14%), Immigrants from Burma/Myanmar (12.1%, a difference of 0.14%), and Cherokee (12.0%, a difference of 0.17%).
DemographicsRating | RankSeniors Poverty Over the Age of 75
Immigrants | Latvia
69.1
/100
|
#147
Good
12.0%
Immigrants | Zaire
67.6
/100
|
#148
Good
12.0%
Asians
67.4
/100
|
#149
Good
12.0%
Cypriots
67.3
/100
|
#150
Good
12.0%
Cherokee
65.8
/100
|
#151
Good
12.0%
Immigrants | Korea
65.5
/100
|
#152
Good
12.0%
Immigrants | Turkey
64.7
/100
|
#153
Good
12.0%
Cambodians
64.0
/100
|
#154
Good
12.0%
Indonesians
62.6
/100
|
#155
Good
12.1%
Immigrants | Burma/Myanmar
62.3
/100
|
#156
Good
12.1%
Immigrants | Sudan
61.7
/100
|
#157
Good
12.1%
Portuguese
61.3
/100
|
#158
Good
12.1%
Immigrants | Middle Africa
61.2
/100
|
#159
Good
12.1%
Immigrants | Eastern Africa
60.9
/100
|
#160
Good
12.1%
Immigrants | Norway
60.6
/100
|
#161
Good
12.1%

Demographics Similar to Immigrants from Latin America by Seniors Poverty Over the Age of 75

In terms of seniors poverty over the age of 75, the demographic groups most similar to Immigrants from Latin America are West Indian (15.7%, a difference of 0.31%), Immigrants from Honduras (15.7%, a difference of 0.48%), Immigrants from Trinidad and Tobago (15.7%, a difference of 0.66%), Ecuadorian (15.7%, a difference of 0.70%), and Bahamian (15.5%, a difference of 0.78%).
DemographicsRating | RankSeniors Poverty Over the Age of 75
Immigrants | Jamaica
0.0
/100
|
#294
Tragic
15.3%
U.S. Virgin Islanders
0.0
/100
|
#295
Tragic
15.4%
Yuman
0.0
/100
|
#296
Tragic
15.4%
Hondurans
0.0
/100
|
#297
Tragic
15.4%
Natives/Alaskans
0.0
/100
|
#298
Tragic
15.5%
Spanish American Indians
0.0
/100
|
#299
Tragic
15.5%
Bahamians
0.0
/100
|
#300
Tragic
15.5%
Immigrants | Latin America
0.0
/100
|
#301
Tragic
15.6%
West Indians
0.0
/100
|
#302
Tragic
15.7%
Immigrants | Honduras
0.0
/100
|
#303
Tragic
15.7%
Immigrants | Trinidad and Tobago
0.0
/100
|
#304
Tragic
15.7%
Ecuadorians
0.0
/100
|
#305
Tragic
15.7%
Hispanics or Latinos
0.0
/100
|
#306
Tragic
15.8%
Immigrants | West Indies
0.0
/100
|
#307
Tragic
15.8%
Immigrants | Bangladesh
0.0
/100
|
#308
Tragic
15.8%