Indonesian vs Immigrants from South Africa Seniors Poverty Over the Age of 75
COMPARE
Indonesian
Immigrants from South Africa
Seniors Poverty Over the Age of 75
Seniors Poverty Over the Age of 75 Comparison
Indonesians
Immigrants from South Africa
12.1%
SENIORS POVERTY OVER THE AGE OF 75
62.6/ 100
METRIC RATING
155th/ 347
METRIC RANK
11.5%
SENIORS POVERTY OVER THE AGE OF 75
94.9/ 100
METRIC RATING
83rd/ 347
METRIC RANK
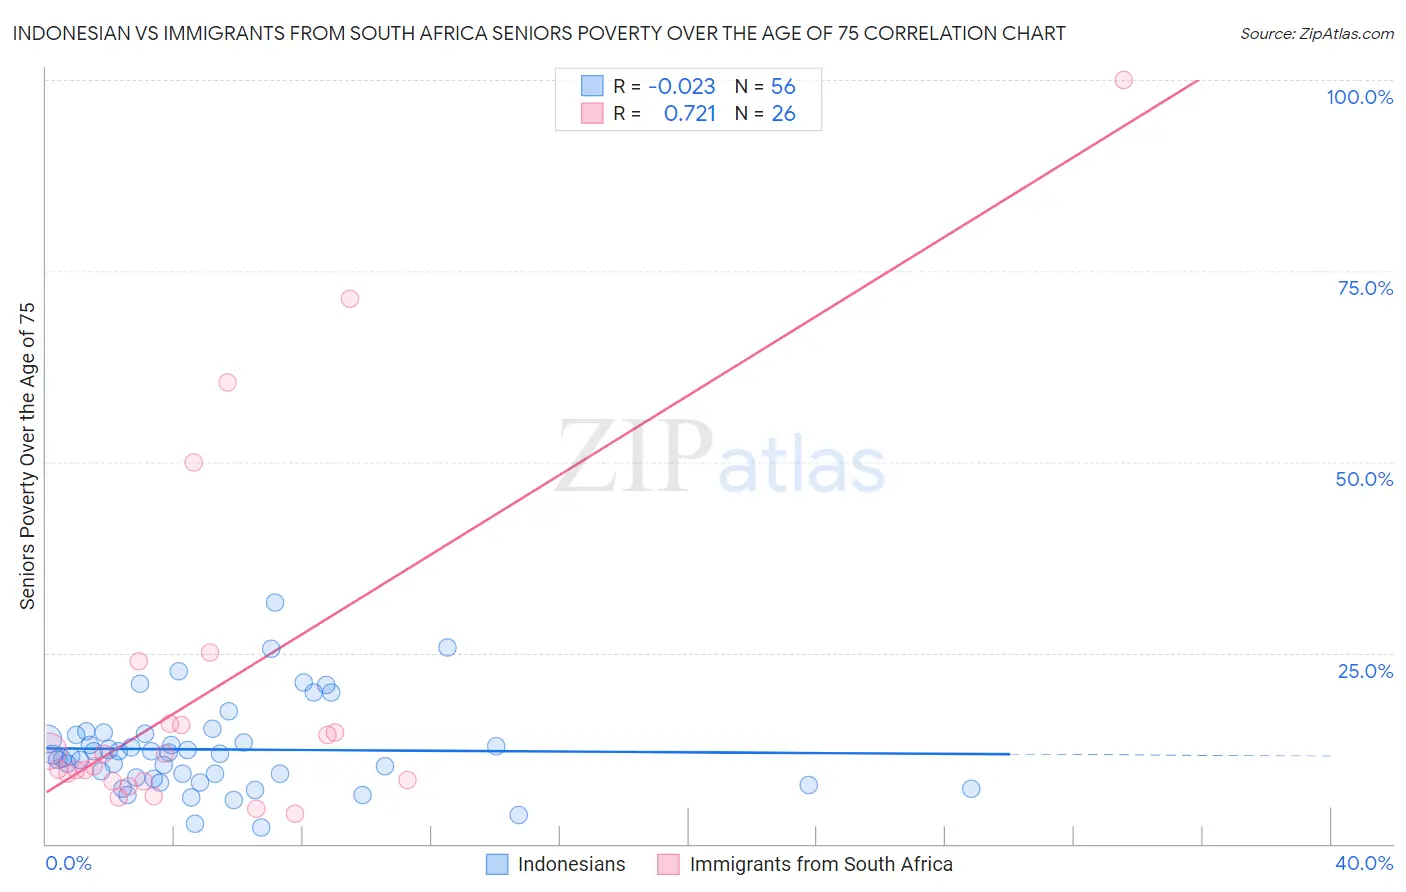
Indonesian vs Immigrants from South Africa Seniors Poverty Over the Age of 75 Correlation Chart
The statistical analysis conducted on geographies consisting of 161,954,632 people shows no correlation between the proportion of Indonesians and poverty level among seniors over the age of 75 in the United States with a correlation coefficient (R) of -0.023 and weighted average of 12.1%. Similarly, the statistical analysis conducted on geographies consisting of 231,486,555 people shows a strong positive correlation between the proportion of Immigrants from South Africa and poverty level among seniors over the age of 75 in the United States with a correlation coefficient (R) of 0.721 and weighted average of 11.5%, a difference of 5.2%.
Seniors Poverty Over the Age of 75 Correlation Summary
| Measurement | Indonesian | Immigrants from South Africa |
| Minimum | 2.1% | 4.0% |
| Maximum | 31.5% | 100.0% |
| Range | 29.5% | 96.0% |
| Mean | 12.3% | 20.3% |
| Median | 11.8% | 11.0% |
| Interquartile 25% (IQ1) | 8.6% | 8.3% |
| Interquartile 75% (IQ3) | 14.3% | 15.7% |
| Interquartile Range (IQR) | 5.7% | 7.5% |
| Standard Deviation (Sample) | 5.8% | 23.6% |
| Standard Deviation (Population) | 5.8% | 23.1% |
Similar Demographics by Seniors Poverty Over the Age of 75
Demographics Similar to Indonesians by Seniors Poverty Over the Age of 75
In terms of seniors poverty over the age of 75, the demographic groups most similar to Indonesians are Immigrants from Burma/Myanmar (12.1%, a difference of 0.020%), Immigrants from Sudan (12.1%, a difference of 0.080%), Cambodian (12.0%, a difference of 0.12%), Portuguese (12.1%, a difference of 0.12%), and Immigrants from Middle Africa (12.1%, a difference of 0.12%).
| Demographics | Rating | Rank | Seniors Poverty Over the Age of 75 |
| Immigrants | Zaire | 67.6 /100 | #148 | Good 12.0% |
| Asians | 67.4 /100 | #149 | Good 12.0% |
| Cypriots | 67.3 /100 | #150 | Good 12.0% |
| Cherokee | 65.8 /100 | #151 | Good 12.0% |
| Immigrants | Korea | 65.5 /100 | #152 | Good 12.0% |
| Immigrants | Turkey | 64.7 /100 | #153 | Good 12.0% |
| Cambodians | 64.0 /100 | #154 | Good 12.0% |
| Indonesians | 62.6 /100 | #155 | Good 12.1% |
| Immigrants | Burma/Myanmar | 62.3 /100 | #156 | Good 12.1% |
| Immigrants | Sudan | 61.7 /100 | #157 | Good 12.1% |
| Portuguese | 61.3 /100 | #158 | Good 12.1% |
| Immigrants | Middle Africa | 61.2 /100 | #159 | Good 12.1% |
| Immigrants | Eastern Africa | 60.9 /100 | #160 | Good 12.1% |
| Immigrants | Norway | 60.6 /100 | #161 | Good 12.1% |
| Immigrants | Serbia | 60.2 /100 | #162 | Good 12.1% |
Demographics Similar to Immigrants from South Africa by Seniors Poverty Over the Age of 75
In terms of seniors poverty over the age of 75, the demographic groups most similar to Immigrants from South Africa are Immigrants from Iraq (11.5%, a difference of 0.0%), Iranian (11.5%, a difference of 0.080%), Basque (11.5%, a difference of 0.10%), Immigrants from Bulgaria (11.5%, a difference of 0.11%), and Australian (11.5%, a difference of 0.13%).
| Demographics | Rating | Rank | Seniors Poverty Over the Age of 75 |
| French Canadians | 95.7 /100 | #76 | Exceptional 11.4% |
| Whites/Caucasians | 95.5 /100 | #77 | Exceptional 11.4% |
| Macedonians | 95.5 /100 | #78 | Exceptional 11.4% |
| Filipinos | 95.5 /100 | #79 | Exceptional 11.4% |
| Alaska Natives | 95.4 /100 | #80 | Exceptional 11.4% |
| Basques | 95.1 /100 | #81 | Exceptional 11.5% |
| Iranians | 95.1 /100 | #82 | Exceptional 11.5% |
| Immigrants | South Africa | 94.9 /100 | #83 | Exceptional 11.5% |
| Immigrants | Iraq | 94.9 /100 | #84 | Exceptional 11.5% |
| Immigrants | Bulgaria | 94.7 /100 | #85 | Exceptional 11.5% |
| Australians | 94.6 /100 | #86 | Exceptional 11.5% |
| Koreans | 94.5 /100 | #87 | Exceptional 11.5% |
| Immigrants | Croatia | 94.5 /100 | #88 | Exceptional 11.5% |
| Immigrants | Sri Lanka | 94.4 /100 | #89 | Exceptional 11.5% |
| Aleuts | 94.1 /100 | #90 | Exceptional 11.5% |