Immigrants from Venezuela vs Immigrants from Egypt Single Father Poverty

COMPARE

Immigrants from Venezuela
Race
Ancestry
AfghanAfricanAlaska NativeAlaskan AthabascanAlbanianAleutAlsatianAmericanApacheArabArapahoArgentineanArmenianAssyrian/Chaldean/SyriacAustralianAustrianBahamianBangladeshiBarbadianBasqueBelgianBelizeanBermudanBhutaneseBlackfeetBolivianBrazilianBritishBritish West IndianBulgarianBurmeseCajunCambodianCanadianCape VerdeanCarpatho RusynCelticCentral AmericanCentral American IndianCherokeeCheyenneChickasawChileanChineseChippewaChoctawColombianColvilleComancheCosta RicanCreeCreekCroatianCrowCubanCypriotCzechCzechoslovakianDanishDelawareDominicanDutchDutch West IndianEastern EuropeanEcuadorianEgyptianEnglishEstonianEthiopianEuropeanFijianFilipinoFinnishFrenchFrench American IndianFrench CanadianGermanGerman RussianGhanaianGreekGuamanian/ChamorroGuatemalanGuyaneseHaitianHmongHonduranHopiHoumaHungarianIcelanderIndian (Asian)IndonesianInupiatIranianIraqiIrishIroquoisIsraeliItalianJamaicanJapaneseJordanianKenyanKiowaKoreanLaotianLatvianLebaneseLiberianLithuanianLumbeeLuxembourgerMacedonianMalaysianMalteseMarshalleseMenomineeMexicanMexican American IndianMongolianMoroccanNative HawaiianNavajoNepaleseNew ZealanderNicaraguanNigerianNorthern EuropeanNorwegianOkinawanOsageOttawaPaiutePakistaniPalestinianPanamanianParaguayanPennsylvania GermanPeruvianPimaPolishPortuguesePotawatomiPuebloPuerto RicanPuget Sound SalishRomanianRussianSalvadoranSamoanScandinavianScotch-IrishScottishSeminoleSenegaleseSerbianShoshoneSierra LeoneanSiouxSlavicSlovakSloveneSomaliSouth AfricanSouth AmericanSouth American IndianSoviet UnionSpaniardSpanishSpanish AmericanSpanish American IndianSri LankanSubsaharan AfricanSudaneseSwedishSwissSyrianTaiwaneseThaiTlingit-HaidaTohono O'OdhamTonganTrinidadian and TobagonianTsimshianTurkishU.S. Virgin IslanderUgandanUkrainianUruguayanUteVenezuelanVietnameseWelshWest IndianYakamaYaquiYugoslavianYumanYup'ikZimbabwean
Immigration
NonimmigrantsImmigrantsAfghanistanAfricaAlbaniaArgentinaArmeniaAsiaAustraliaAustriaBahamasBangladeshBarbadosBelarusBelgiumBelizeBoliviaBosnia and HerzegovinaBrazilBulgariaBurma/MyanmarCabo VerdeCambodiaCameroonCanadaCaribbeanCentral AmericaChileChinaColombiaCongoCosta RicaCroatiaCubaCzechoslovakiaDenmarkDominicaDominican RepublicEastern AfricaEastern AsiaEastern EuropeEcuadorEl SalvadorEnglandEritreaEthiopiaEuropeFijiFranceGermanyGhanaGreeceGrenadaGuatemalaGuyanaHaitiHondurasHong KongHungaryIndiaIndonesiaIranIraqIrelandIsraelItalyJamaicaJapanJordanKazakhstanKenyaKoreaKuwaitLaosLatin AmericaLatviaLebanonLiberiaLithuaniaMalaysiaMexicoMicronesiaMiddle AfricaMoldovaMoroccoNepalNetherlandsNicaraguaNigeriaNorth AmericaNorth MacedoniaNorthern AfricaNorthern EuropeNorwayOceaniaPakistanPanamaPeruPhilippinesPolandPortugalRomaniaRussiaSaudi ArabiaScotlandSenegalSerbiaSierra LeoneSingaporeSomaliaSouth AfricaSouth AmericaSouth Central AsiaSouth Eastern AsiaSouthern EuropeSpainSri LankaSt. Vincent and the GrenadinesSudanSwedenSwitzerlandSyriaTaiwanThailandTrinidad and TobagoTurkeyUgandaUkraineUruguayUzbekistanVenezuelaVietnamWest IndiesWestern AfricaWestern AsiaWestern EuropeYemenZaireZimbabweAzores
Immigrants from Egypt
Race
Ancestry
AfghanAfricanAlaska NativeAlaskan AthabascanAlbanianAleutAlsatianAmericanApacheArabArapahoArgentineanArmenianAssyrian/Chaldean/SyriacAustralianAustrianBahamianBangladeshiBarbadianBasqueBelgianBelizeanBermudanBhutaneseBlackfeetBolivianBrazilianBritishBritish West IndianBulgarianBurmeseCajunCambodianCanadianCape VerdeanCarpatho RusynCelticCentral AmericanCentral American IndianCherokeeCheyenneChickasawChileanChineseChippewaChoctawColombianColvilleComancheCosta RicanCreeCreekCroatianCrowCubanCypriotCzechCzechoslovakianDanishDelawareDominicanDutchDutch West IndianEastern EuropeanEcuadorianEgyptianEnglishEstonianEthiopianEuropeanFijianFilipinoFinnishFrenchFrench American IndianFrench CanadianGermanGerman RussianGhanaianGreekGuamanian/ChamorroGuatemalanGuyaneseHaitianHmongHonduranHopiHoumaHungarianIcelanderIndian (Asian)IndonesianInupiatIranianIraqiIrishIroquoisIsraeliItalianJamaicanJapaneseJordanianKenyanKiowaKoreanLaotianLatvianLebaneseLiberianLithuanianLumbeeLuxembourgerMacedonianMalaysianMalteseMarshalleseMenomineeMexicanMexican American IndianMongolianMoroccanNative HawaiianNavajoNepaleseNew ZealanderNicaraguanNigerianNorthern EuropeanNorwegianOkinawanOsageOttawaPaiutePakistaniPalestinianPanamanianParaguayanPennsylvania GermanPeruvianPimaPolishPortuguesePotawatomiPuebloPuerto RicanPuget Sound SalishRomanianRussianSalvadoranSamoanScandinavianScotch-IrishScottishSeminoleSenegaleseSerbianShoshoneSierra LeoneanSiouxSlavicSlovakSloveneSomaliSouth AfricanSouth AmericanSouth American IndianSoviet UnionSpaniardSpanishSpanish AmericanSpanish American IndianSri LankanSubsaharan AfricanSudaneseSwedishSwissSyrianTaiwaneseThaiTlingit-HaidaTohono O'OdhamTonganTrinidadian and TobagonianTsimshianTurkishU.S. Virgin IslanderUgandanUkrainianUruguayanUteVenezuelanVietnameseWelshWest IndianYakamaYaquiYugoslavianYumanYup'ikZimbabwean
Immigration
NonimmigrantsImmigrantsAfghanistanAfricaAlbaniaArgentinaArmeniaAsiaAustraliaAustriaBahamasBangladeshBarbadosBelarusBelgiumBelizeBoliviaBosnia and HerzegovinaBrazilBulgariaBurma/MyanmarCabo VerdeCambodiaCameroonCanadaCaribbeanCentral AmericaChileChinaColombiaCongoCosta RicaCroatiaCubaCzechoslovakiaDenmarkDominicaDominican RepublicEastern AfricaEastern AsiaEastern EuropeEcuadorEgyptEl SalvadorEnglandEritreaEthiopiaEuropeFijiFranceGermanyGhanaGreeceGrenadaGuatemalaGuyanaHaitiHondurasHong KongHungaryIndiaIndonesiaIranIraqIrelandIsraelItalyJamaicaJapanJordanKazakhstanKenyaKoreaKuwaitLaosLatin AmericaLatviaLebanonLiberiaLithuaniaMalaysiaMexicoMicronesiaMiddle AfricaMoldovaMoroccoNepalNetherlandsNicaraguaNigeriaNorth AmericaNorth MacedoniaNorthern AfricaNorthern EuropeNorwayOceaniaPakistanPanamaPeruPhilippinesPolandPortugalRomaniaRussiaSaudi ArabiaScotlandSenegalSerbiaSierra LeoneSingaporeSomaliaSouth AfricaSouth AmericaSouth Central AsiaSouth Eastern AsiaSouthern EuropeSpainSri LankaSt. Vincent and the GrenadinesSudanSwedenSwitzerlandSyriaTaiwanThailandTrinidad and TobagoTurkeyUgandaUkraineUruguayUzbekistanVietnamWest IndiesWestern AfricaWestern AsiaWestern EuropeYemenZaireZimbabweAzores
Single Father Poverty
Income
Poverty
Unemployment
Labor Participation
Family Structure
Vehicle Availability
Education Level
Disability

Single Father Poverty Comparison

Immigrants from Venezuela

Immigrants from Egypt

Fair
Exceptional
16.4%
SINGLE FATHER POVERTY
31.0/ 100
METRIC RATING
186th/ 347
METRIC RANK
14.4%
SINGLE FATHER POVERTY
100.0/ 100
METRIC RATING
23rd/ 347
METRIC RANK

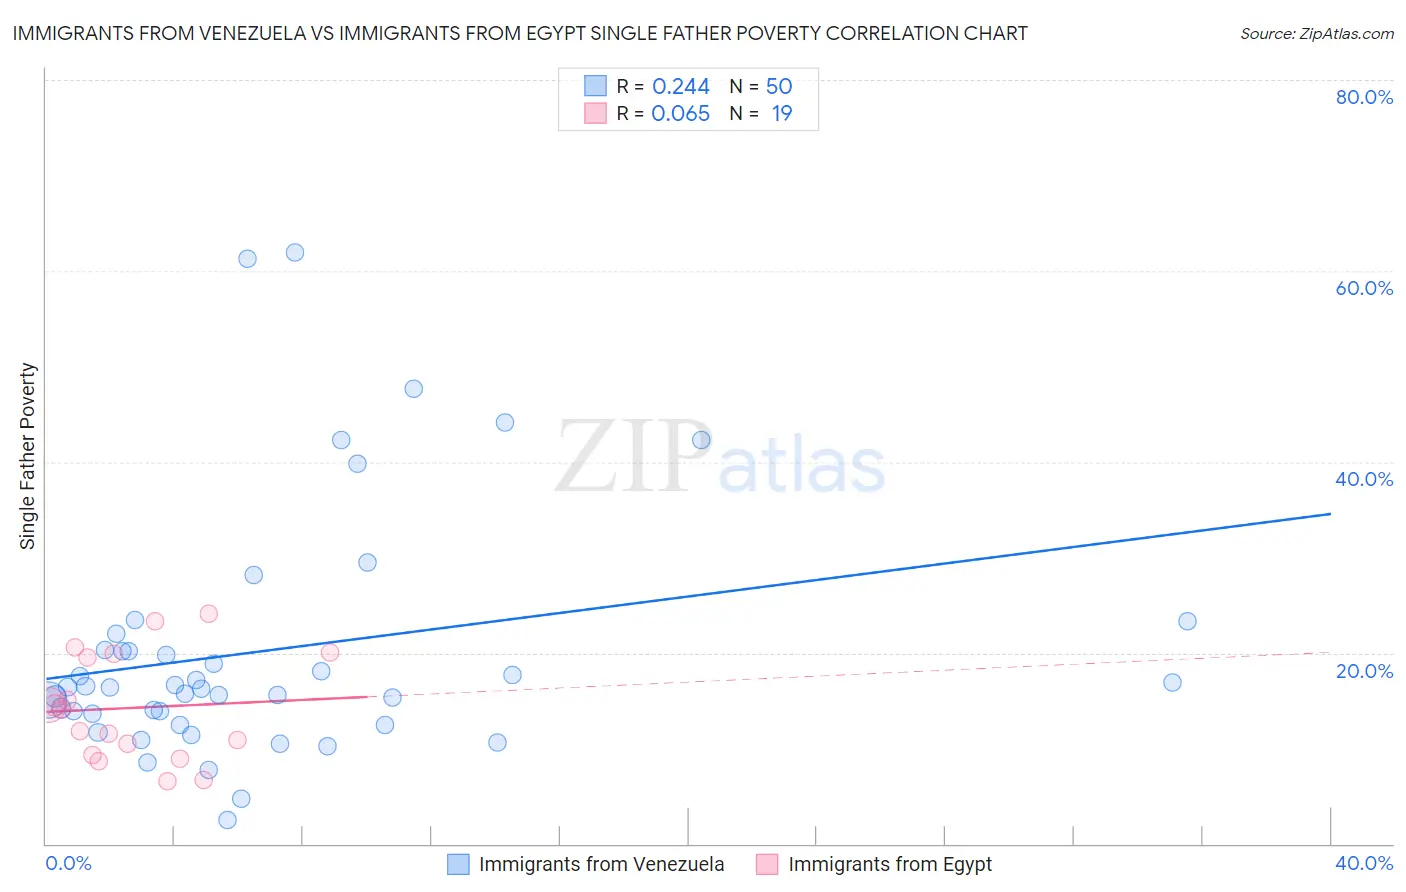
Immigrants from Venezuela vs Immigrants from Egypt Single Father Poverty Correlation Chart

The statistical analysis conducted on geographies consisting of 236,867,266 people shows a weak positive correlation between the proportion of Immigrants from Venezuela and poverty level among single fathers in the United States with a correlation coefficient (R) of 0.244 and weighted average of 16.4%. Similarly, the statistical analysis conducted on geographies consisting of 202,331,150 people shows a slight positive correlation between the proportion of Immigrants from Egypt and poverty level among single fathers in the United States with a correlation coefficient (R) of 0.065 and weighted average of 14.4%, a difference of 14.5%.
Immigrants from Venezuela vs Immigrants from Egypt Single Father Poverty

Single Father Poverty Correlation Summary

MeasurementImmigrants from VenezuelaImmigrants from Egypt
Minimum2.4%6.6%
Maximum61.9%24.1%
Range59.5%17.6%
Mean20.2%14.2%
Median16.4%14.0%
Interquartile 25% (IQ1)13.6%9.3%
Interquartile 75% (IQ3)20.3%19.9%
Interquartile Range (IQR)6.7%10.6%
Standard Deviation (Sample)12.9%5.5%
Standard Deviation (Population)12.8%5.4%

Similar Demographics by Single Father Poverty

Demographics Similar to Immigrants from Venezuela by Single Father Poverty

In terms of single father poverty, the demographic groups most similar to Immigrants from Venezuela are Ukrainian (16.4%, a difference of 0.030%), Russian (16.4%, a difference of 0.050%), Latvian (16.5%, a difference of 0.11%), Panamanian (16.4%, a difference of 0.13%), and Immigrants from Burma/Myanmar (16.5%, a difference of 0.16%).
DemographicsRating | RankSingle Father Poverty
Serbians
40.9
/100
|
#179
Average
16.4%
Immigrants | Latin America
37.2
/100
|
#180
Fair
16.4%
Immigrants | Western Africa
36.0
/100
|
#181
Fair
16.4%
Immigrants | Italy
35.7
/100
|
#182
Fair
16.4%
Aleuts
35.3
/100
|
#183
Fair
16.4%
Cambodians
34.6
/100
|
#184
Fair
16.4%
Panamanians
33.6
/100
|
#185
Fair
16.4%
Immigrants | Venezuela
31.0
/100
|
#186
Fair
16.4%
Ukrainians
30.4
/100
|
#187
Fair
16.4%
Russians
30.1
/100
|
#188
Fair
16.4%
Latvians
28.9
/100
|
#189
Fair
16.5%
Immigrants | Burma/Myanmar
28.0
/100
|
#190
Fair
16.5%
Immigrants | Guyana
27.1
/100
|
#191
Fair
16.5%
Immigrants | Switzerland
24.8
/100
|
#192
Fair
16.5%
Ecuadorians
24.5
/100
|
#193
Fair
16.5%

Demographics Similar to Immigrants from Egypt by Single Father Poverty

In terms of single father poverty, the demographic groups most similar to Immigrants from Egypt are Immigrants from South Eastern Asia (14.4%, a difference of 0.010%), Iranian (14.4%, a difference of 0.040%), Taiwanese (14.3%, a difference of 0.21%), Spanish American Indian (14.4%, a difference of 0.46%), and Nepalese (14.4%, a difference of 0.52%).
DemographicsRating | RankSingle Father Poverty
Immigrants | Iran
100.0
/100
|
#16
Exceptional
14.2%
Immigrants | Hong Kong
100.0
/100
|
#17
Exceptional
14.2%
Soviet Union
100.0
/100
|
#18
Exceptional
14.3%
Immigrants | Iraq
100.0
/100
|
#19
Exceptional
14.3%
Immigrants | Singapore
100.0
/100
|
#20
Exceptional
14.3%
Immigrants | Afghanistan
100.0
/100
|
#21
Exceptional
14.3%
Taiwanese
100.0
/100
|
#22
Exceptional
14.3%
Immigrants | Egypt
100.0
/100
|
#23
Exceptional
14.4%
Immigrants | South Eastern Asia
100.0
/100
|
#24
Exceptional
14.4%
Iranians
100.0
/100
|
#25
Exceptional
14.4%
Spanish American Indians
100.0
/100
|
#26
Exceptional
14.4%
Nepalese
100.0
/100
|
#27
Exceptional
14.4%
Immigrants | South Central Asia
100.0
/100
|
#28
Exceptional
14.5%
Somalis
100.0
/100
|
#29
Exceptional
14.5%
Thais
100.0
/100
|
#30
Exceptional
14.5%