French vs Immigrants from Egypt Single Father Poverty

COMPARE

French
Race
Ancestry
AfghanAfricanAlaska NativeAlaskan AthabascanAlbanianAleutAlsatianAmericanApacheArabArapahoArgentineanArmenianAssyrian/Chaldean/SyriacAustralianAustrianBahamianBangladeshiBarbadianBasqueBelgianBelizeanBermudanBhutaneseBlackfeetBolivianBrazilianBritishBritish West IndianBulgarianBurmeseCajunCambodianCanadianCape VerdeanCarpatho RusynCelticCentral AmericanCentral American IndianCherokeeCheyenneChickasawChileanChineseChippewaChoctawColombianColvilleComancheCosta RicanCreeCreekCroatianCrowCubanCypriotCzechCzechoslovakianDanishDelawareDominicanDutchDutch West IndianEastern EuropeanEcuadorianEgyptianEnglishEstonianEthiopianEuropeanFijianFilipinoFinnishFrenchFrench American IndianFrench CanadianGermanGerman RussianGhanaianGreekGuamanian/ChamorroGuatemalanGuyaneseHaitianHmongHonduranHopiHoumaHungarianIcelanderIndian (Asian)IndonesianInupiatIranianIraqiIrishIroquoisIsraeliItalianJamaicanJapaneseJordanianKenyanKiowaKoreanLaotianLatvianLebaneseLiberianLithuanianLumbeeLuxembourgerMacedonianMalaysianMalteseMarshalleseMenomineeMexicanMexican American IndianMongolianMoroccanNative HawaiianNavajoNepaleseNew ZealanderNicaraguanNigerianNorthern EuropeanNorwegianOkinawanOsageOttawaPaiutePakistaniPalestinianPanamanianParaguayanPennsylvania GermanPeruvianPimaPolishPortuguesePotawatomiPuebloPuerto RicanPuget Sound SalishRomanianRussianSalvadoranSamoanScandinavianScotch-IrishScottishSeminoleSenegaleseSerbianShoshoneSierra LeoneanSiouxSlavicSlovakSloveneSomaliSouth AfricanSouth AmericanSouth American IndianSoviet UnionSpaniardSpanishSpanish AmericanSpanish American IndianSri LankanSubsaharan AfricanSudaneseSwedishSwissSyrianTaiwaneseThaiTlingit-HaidaTohono O'OdhamTonganTrinidadian and TobagonianTsimshianTurkishU.S. Virgin IslanderUgandanUkrainianUruguayanUteVenezuelanVietnameseWelshWest IndianYakamaYaquiYugoslavianYumanYup'ikZimbabwean
Immigration
NonimmigrantsImmigrantsAfghanistanAfricaAlbaniaArgentinaArmeniaAsiaAustraliaAustriaBahamasBangladeshBarbadosBelarusBelgiumBelizeBoliviaBosnia and HerzegovinaBrazilBulgariaBurma/MyanmarCabo VerdeCambodiaCameroonCanadaCaribbeanCentral AmericaChileChinaColombiaCongoCosta RicaCroatiaCubaCzechoslovakiaDenmarkDominicaDominican RepublicEastern AfricaEastern AsiaEastern EuropeEcuadorEl SalvadorEnglandEritreaEthiopiaEuropeFijiFranceGermanyGhanaGreeceGrenadaGuatemalaGuyanaHaitiHondurasHong KongHungaryIndiaIndonesiaIranIraqIrelandIsraelItalyJamaicaJapanJordanKazakhstanKenyaKoreaKuwaitLaosLatin AmericaLatviaLebanonLiberiaLithuaniaMalaysiaMexicoMicronesiaMiddle AfricaMoldovaMoroccoNepalNetherlandsNicaraguaNigeriaNorth AmericaNorth MacedoniaNorthern AfricaNorthern EuropeNorwayOceaniaPakistanPanamaPeruPhilippinesPolandPortugalRomaniaRussiaSaudi ArabiaScotlandSenegalSerbiaSierra LeoneSingaporeSomaliaSouth AfricaSouth AmericaSouth Central AsiaSouth Eastern AsiaSouthern EuropeSpainSri LankaSt. Vincent and the GrenadinesSudanSwedenSwitzerlandSyriaTaiwanThailandTrinidad and TobagoTurkeyUgandaUkraineUruguayUzbekistanVenezuelaVietnamWest IndiesWestern AfricaWestern AsiaWestern EuropeYemenZaireZimbabweAzores
Immigrants from Egypt
Race
Ancestry
AfghanAfricanAlaska NativeAlaskan AthabascanAlbanianAleutAlsatianAmericanApacheArabArapahoArgentineanArmenianAssyrian/Chaldean/SyriacAustralianAustrianBahamianBangladeshiBarbadianBasqueBelgianBelizeanBermudanBhutaneseBlackfeetBolivianBrazilianBritishBritish West IndianBulgarianBurmeseCajunCambodianCanadianCape VerdeanCarpatho RusynCelticCentral AmericanCentral American IndianCherokeeCheyenneChickasawChileanChineseChippewaChoctawColombianColvilleComancheCosta RicanCreeCreekCroatianCrowCubanCypriotCzechCzechoslovakianDanishDelawareDominicanDutchDutch West IndianEastern EuropeanEcuadorianEgyptianEnglishEstonianEthiopianEuropeanFijianFilipinoFinnishFrench American IndianFrench CanadianGermanGerman RussianGhanaianGreekGuamanian/ChamorroGuatemalanGuyaneseHaitianHmongHonduranHopiHoumaHungarianIcelanderIndian (Asian)IndonesianInupiatIranianIraqiIrishIroquoisIsraeliItalianJamaicanJapaneseJordanianKenyanKiowaKoreanLaotianLatvianLebaneseLiberianLithuanianLumbeeLuxembourgerMacedonianMalaysianMalteseMarshalleseMenomineeMexicanMexican American IndianMongolianMoroccanNative HawaiianNavajoNepaleseNew ZealanderNicaraguanNigerianNorthern EuropeanNorwegianOkinawanOsageOttawaPaiutePakistaniPalestinianPanamanianParaguayanPennsylvania GermanPeruvianPimaPolishPortuguesePotawatomiPuebloPuerto RicanPuget Sound SalishRomanianRussianSalvadoranSamoanScandinavianScotch-IrishScottishSeminoleSenegaleseSerbianShoshoneSierra LeoneanSiouxSlavicSlovakSloveneSomaliSouth AfricanSouth AmericanSouth American IndianSoviet UnionSpaniardSpanishSpanish AmericanSpanish American IndianSri LankanSubsaharan AfricanSudaneseSwedishSwissSyrianTaiwaneseThaiTlingit-HaidaTohono O'OdhamTonganTrinidadian and TobagonianTsimshianTurkishU.S. Virgin IslanderUgandanUkrainianUruguayanUteVenezuelanVietnameseWelshWest IndianYakamaYaquiYugoslavianYumanYup'ikZimbabwean
Immigration
NonimmigrantsImmigrantsAfghanistanAfricaAlbaniaArgentinaArmeniaAsiaAustraliaAustriaBahamasBangladeshBarbadosBelarusBelgiumBelizeBoliviaBosnia and HerzegovinaBrazilBulgariaBurma/MyanmarCabo VerdeCambodiaCameroonCanadaCaribbeanCentral AmericaChileChinaColombiaCongoCosta RicaCroatiaCubaCzechoslovakiaDenmarkDominicaDominican RepublicEastern AfricaEastern AsiaEastern EuropeEcuadorEgyptEl SalvadorEnglandEritreaEthiopiaEuropeFijiFranceGermanyGhanaGreeceGrenadaGuatemalaGuyanaHaitiHondurasHong KongHungaryIndiaIndonesiaIranIraqIrelandIsraelItalyJamaicaJapanJordanKazakhstanKenyaKoreaKuwaitLaosLatin AmericaLatviaLebanonLiberiaLithuaniaMalaysiaMexicoMicronesiaMiddle AfricaMoldovaMoroccoNepalNetherlandsNicaraguaNigeriaNorth AmericaNorth MacedoniaNorthern AfricaNorthern EuropeNorwayOceaniaPakistanPanamaPeruPhilippinesPolandPortugalRomaniaRussiaSaudi ArabiaScotlandSenegalSerbiaSierra LeoneSingaporeSomaliaSouth AfricaSouth AmericaSouth Central AsiaSouth Eastern AsiaSouthern EuropeSpainSri LankaSt. Vincent and the GrenadinesSudanSwedenSwitzerlandSyriaTaiwanThailandTrinidad and TobagoTurkeyUgandaUkraineUruguayUzbekistanVenezuelaVietnamWest IndiesWestern AfricaWestern AsiaWestern EuropeYemenZaireZimbabweAzores
Single Father Poverty
Income
Poverty
Unemployment
Labor Participation
Family Structure
Vehicle Availability
Education Level
Disability

Single Father Poverty Comparison

French

Immigrants from Egypt

Tragic
Exceptional
18.2%
SINGLE FATHER POVERTY
0.0/ 100
METRIC RATING
297th/ 347
METRIC RANK
14.4%
SINGLE FATHER POVERTY
100.0/ 100
METRIC RATING
23rd/ 347
METRIC RANK

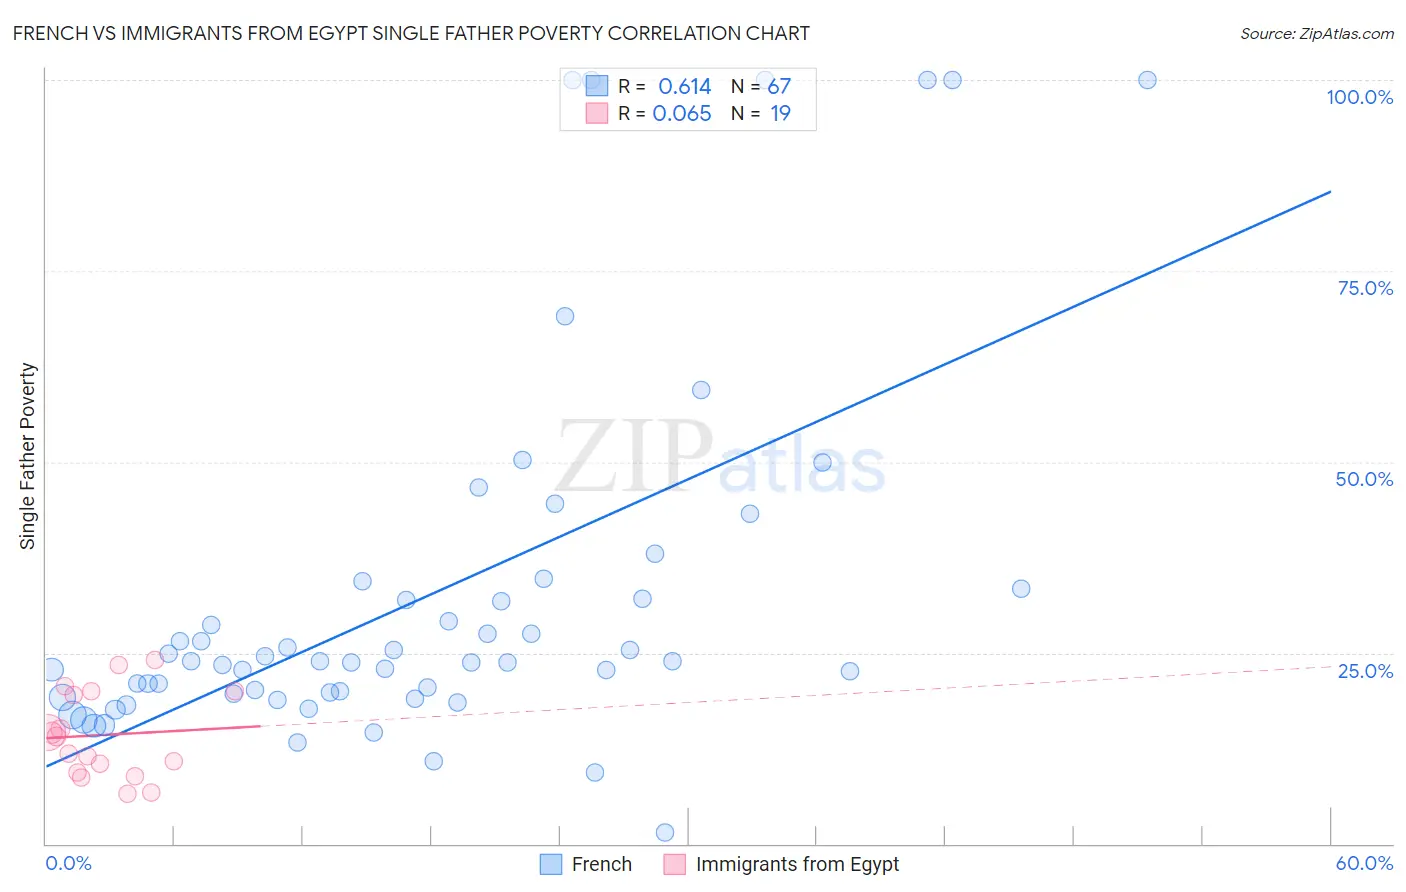
French vs Immigrants from Egypt Single Father Poverty Correlation Chart

The statistical analysis conducted on geographies consisting of 409,472,161 people shows a significant positive correlation between the proportion of French and poverty level among single fathers in the United States with a correlation coefficient (R) of 0.614 and weighted average of 18.2%. Similarly, the statistical analysis conducted on geographies consisting of 202,331,150 people shows a slight positive correlation between the proportion of Immigrants from Egypt and poverty level among single fathers in the United States with a correlation coefficient (R) of 0.065 and weighted average of 14.4%, a difference of 26.7%.
French vs Immigrants from Egypt Single Father Poverty

Single Father Poverty Correlation Summary

MeasurementFrenchImmigrants from Egypt
Minimum1.4%6.6%
Maximum100.0%24.1%
Range98.6%17.6%
Mean32.5%14.2%
Median23.8%14.0%
Interquartile 25% (IQ1)19.7%9.3%
Interquartile 75% (IQ3)33.3%19.9%
Interquartile Range (IQR)13.7%10.6%
Standard Deviation (Sample)24.1%5.5%
Standard Deviation (Population)23.9%5.4%

Similar Demographics by Single Father Poverty

Demographics Similar to French by Single Father Poverty

In terms of single father poverty, the demographic groups most similar to French are Seminole (18.1%, a difference of 0.21%), Yakama (18.1%, a difference of 0.31%), U.S. Virgin Islander (18.1%, a difference of 0.37%), Alaska Native (18.1%, a difference of 0.40%), and Immigrants from Bahamas (18.1%, a difference of 0.51%).
DemographicsRating | RankSingle Father Poverty
West Indians
0.0
/100
|
#290
Tragic
18.0%
Alaskan Athabascans
0.0
/100
|
#291
Tragic
18.1%
Immigrants | Bahamas
0.0
/100
|
#292
Tragic
18.1%
Alaska Natives
0.0
/100
|
#293
Tragic
18.1%
U.S. Virgin Islanders
0.0
/100
|
#294
Tragic
18.1%
Yakama
0.0
/100
|
#295
Tragic
18.1%
Seminole
0.0
/100
|
#296
Tragic
18.1%
French
0.0
/100
|
#297
Tragic
18.2%
Africans
0.0
/100
|
#298
Tragic
18.3%
Whites/Caucasians
0.0
/100
|
#299
Tragic
18.4%
Immigrants | Dominican Republic
0.0
/100
|
#300
Tragic
18.4%
Hungarians
0.0
/100
|
#301
Tragic
18.5%
Comanche
0.0
/100
|
#302
Tragic
18.5%
Celtics
0.0
/100
|
#303
Tragic
18.5%
Ute
0.0
/100
|
#304
Tragic
18.5%

Demographics Similar to Immigrants from Egypt by Single Father Poverty

In terms of single father poverty, the demographic groups most similar to Immigrants from Egypt are Immigrants from South Eastern Asia (14.4%, a difference of 0.010%), Iranian (14.4%, a difference of 0.040%), Taiwanese (14.3%, a difference of 0.21%), Spanish American Indian (14.4%, a difference of 0.46%), and Nepalese (14.4%, a difference of 0.52%).
DemographicsRating | RankSingle Father Poverty
Immigrants | Iran
100.0
/100
|
#16
Exceptional
14.2%
Immigrants | Hong Kong
100.0
/100
|
#17
Exceptional
14.2%
Soviet Union
100.0
/100
|
#18
Exceptional
14.3%
Immigrants | Iraq
100.0
/100
|
#19
Exceptional
14.3%
Immigrants | Singapore
100.0
/100
|
#20
Exceptional
14.3%
Immigrants | Afghanistan
100.0
/100
|
#21
Exceptional
14.3%
Taiwanese
100.0
/100
|
#22
Exceptional
14.3%
Immigrants | Egypt
100.0
/100
|
#23
Exceptional
14.4%
Immigrants | South Eastern Asia
100.0
/100
|
#24
Exceptional
14.4%
Iranians
100.0
/100
|
#25
Exceptional
14.4%
Spanish American Indians
100.0
/100
|
#26
Exceptional
14.4%
Nepalese
100.0
/100
|
#27
Exceptional
14.4%
Immigrants | South Central Asia
100.0
/100
|
#28
Exceptional
14.5%
Somalis
100.0
/100
|
#29
Exceptional
14.5%
Thais
100.0
/100
|
#30
Exceptional
14.5%