Immigrants from South Central Asia vs Ethiopian Male Poverty
COMPARE
Immigrants from South Central Asia
Ethiopian
Male Poverty
Male Poverty Comparison
Immigrants from South Central Asia
Ethiopians
9.3%
MALE POVERTY
99.9/ 100
METRIC RATING
9th/ 347
METRIC RANK
11.1%
MALE POVERTY
56.7/ 100
METRIC RATING
164th/ 347
METRIC RANK
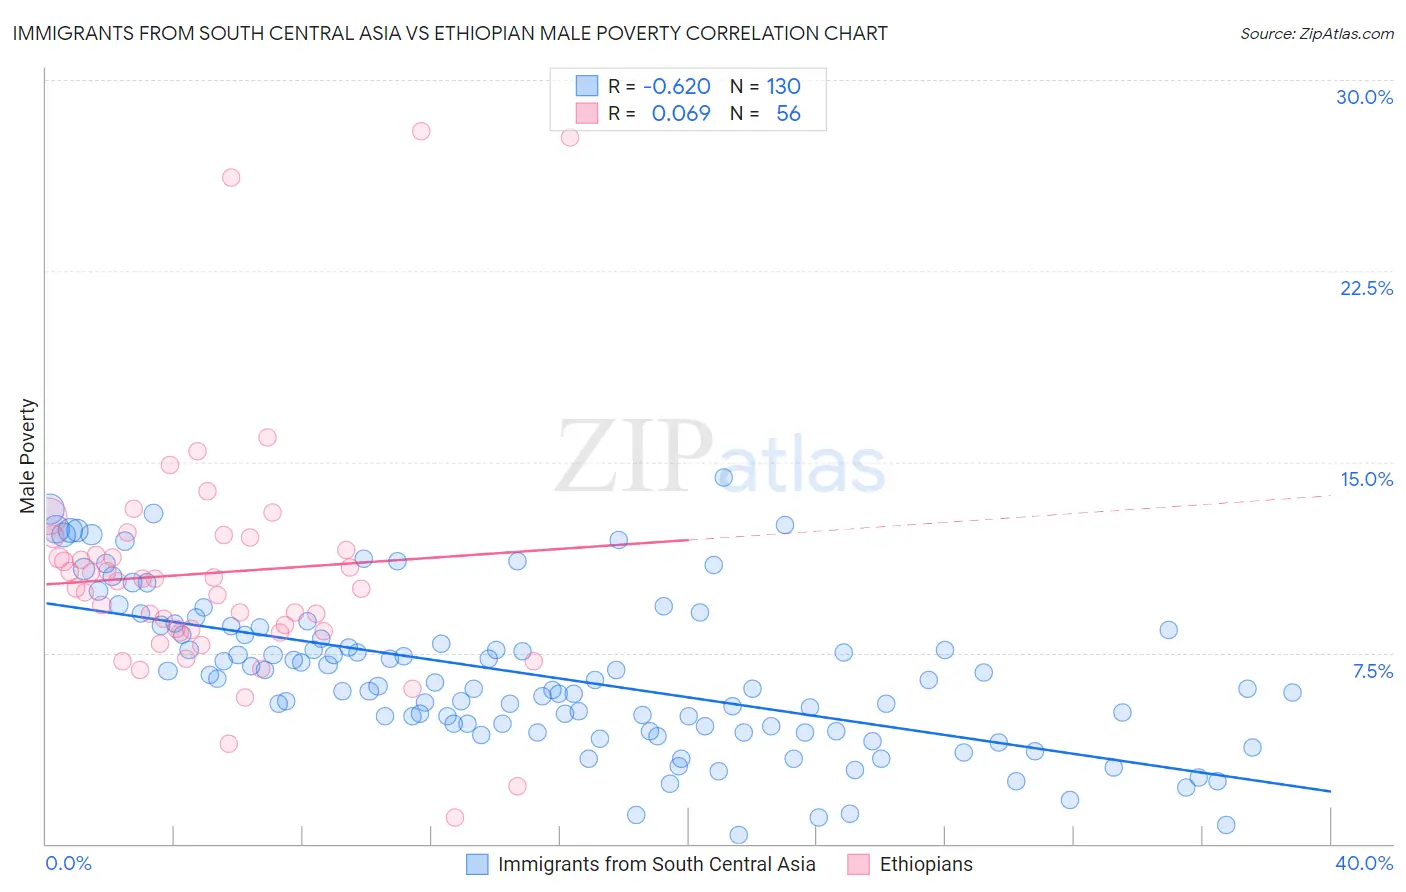
Immigrants from South Central Asia vs Ethiopian Male Poverty Correlation Chart
The statistical analysis conducted on geographies consisting of 472,354,703 people shows a significant negative correlation between the proportion of Immigrants from South Central Asia and poverty level among males in the United States with a correlation coefficient (R) of -0.620 and weighted average of 9.3%. Similarly, the statistical analysis conducted on geographies consisting of 223,096,222 people shows a slight positive correlation between the proportion of Ethiopians and poverty level among males in the United States with a correlation coefficient (R) of 0.069 and weighted average of 11.1%, a difference of 19.9%.
Male Poverty Correlation Summary
| Measurement | Immigrants from South Central Asia | Ethiopian |
| Minimum | 0.33% | 1.0% |
| Maximum | 14.4% | 28.0% |
| Range | 14.0% | 27.0% |
| Mean | 6.6% | 10.6% |
| Median | 6.2% | 10.2% |
| Interquartile 25% (IQ1) | 4.6% | 8.3% |
| Interquartile 75% (IQ3) | 8.4% | 11.8% |
| Interquartile Range (IQR) | 3.8% | 3.5% |
| Standard Deviation (Sample) | 3.0% | 4.9% |
| Standard Deviation (Population) | 3.0% | 4.9% |
Similar Demographics by Male Poverty
Demographics Similar to Immigrants from South Central Asia by Male Poverty
In terms of male poverty, the demographic groups most similar to Immigrants from South Central Asia are Bulgarian (9.3%, a difference of 0.56%), Filipino (9.2%, a difference of 0.79%), Bolivian (9.4%, a difference of 1.2%), Immigrants from Bolivia (9.4%, a difference of 1.3%), and Immigrants from Lithuania (9.4%, a difference of 1.4%).
| Demographics | Rating | Rank | Male Poverty |
| Chinese | 100.0 /100 | #2 | Exceptional 8.7% |
| Thais | 100.0 /100 | #3 | Exceptional 8.7% |
| Immigrants | Taiwan | 100.0 /100 | #4 | Exceptional 8.9% |
| Maltese | 100.0 /100 | #5 | Exceptional 9.1% |
| Assyrians/Chaldeans/Syriacs | 99.9 /100 | #6 | Exceptional 9.1% |
| Immigrants | Ireland | 99.9 /100 | #7 | Exceptional 9.1% |
| Filipinos | 99.9 /100 | #8 | Exceptional 9.2% |
| Immigrants | South Central Asia | 99.9 /100 | #9 | Exceptional 9.3% |
| Bulgarians | 99.9 /100 | #10 | Exceptional 9.3% |
| Bolivians | 99.9 /100 | #11 | Exceptional 9.4% |
| Immigrants | Bolivia | 99.9 /100 | #12 | Exceptional 9.4% |
| Immigrants | Lithuania | 99.9 /100 | #13 | Exceptional 9.4% |
| Immigrants | North Macedonia | 99.8 /100 | #14 | Exceptional 9.4% |
| Bhutanese | 99.8 /100 | #15 | Exceptional 9.5% |
| Luxembourgers | 99.8 /100 | #16 | Exceptional 9.5% |
Demographics Similar to Ethiopians by Male Poverty
In terms of male poverty, the demographic groups most similar to Ethiopians are White/Caucasian (11.1%, a difference of 0.010%), Immigrants from Chile (11.1%, a difference of 0.070%), Immigrants from Spain (11.1%, a difference of 0.12%), Immigrants from Albania (11.1%, a difference of 0.14%), and Hungarian (11.1%, a difference of 0.16%).
| Demographics | Rating | Rank | Male Poverty |
| Scotch-Irish | 63.7 /100 | #157 | Good 11.0% |
| Colombians | 63.0 /100 | #158 | Good 11.0% |
| Taiwanese | 62.7 /100 | #159 | Good 11.0% |
| Soviet Union | 60.3 /100 | #160 | Good 11.1% |
| Immigrants | Northern Africa | 59.7 /100 | #161 | Average 11.1% |
| Immigrants | Chile | 57.4 /100 | #162 | Average 11.1% |
| Whites/Caucasians | 56.7 /100 | #163 | Average 11.1% |
| Ethiopians | 56.7 /100 | #164 | Average 11.1% |
| Immigrants | Spain | 55.5 /100 | #165 | Average 11.1% |
| Immigrants | Albania | 55.3 /100 | #166 | Average 11.1% |
| Hungarians | 55.1 /100 | #167 | Average 11.1% |
| Immigrants | Portugal | 54.9 /100 | #168 | Average 11.1% |
| Immigrants | Colombia | 54.2 /100 | #169 | Average 11.1% |
| South Americans | 53.8 /100 | #170 | Average 11.1% |
| Uruguayans | 51.0 /100 | #171 | Average 11.2% |