Immigrants from Grenada vs Ethiopian Male Poverty
COMPARE
Immigrants from Grenada
Ethiopian
Male Poverty
Male Poverty Comparison
Immigrants from Grenada
Ethiopians
14.7%
MALE POVERTY
0.0/ 100
METRIC RATING
318th/ 347
METRIC RANK
11.1%
MALE POVERTY
56.7/ 100
METRIC RATING
164th/ 347
METRIC RANK
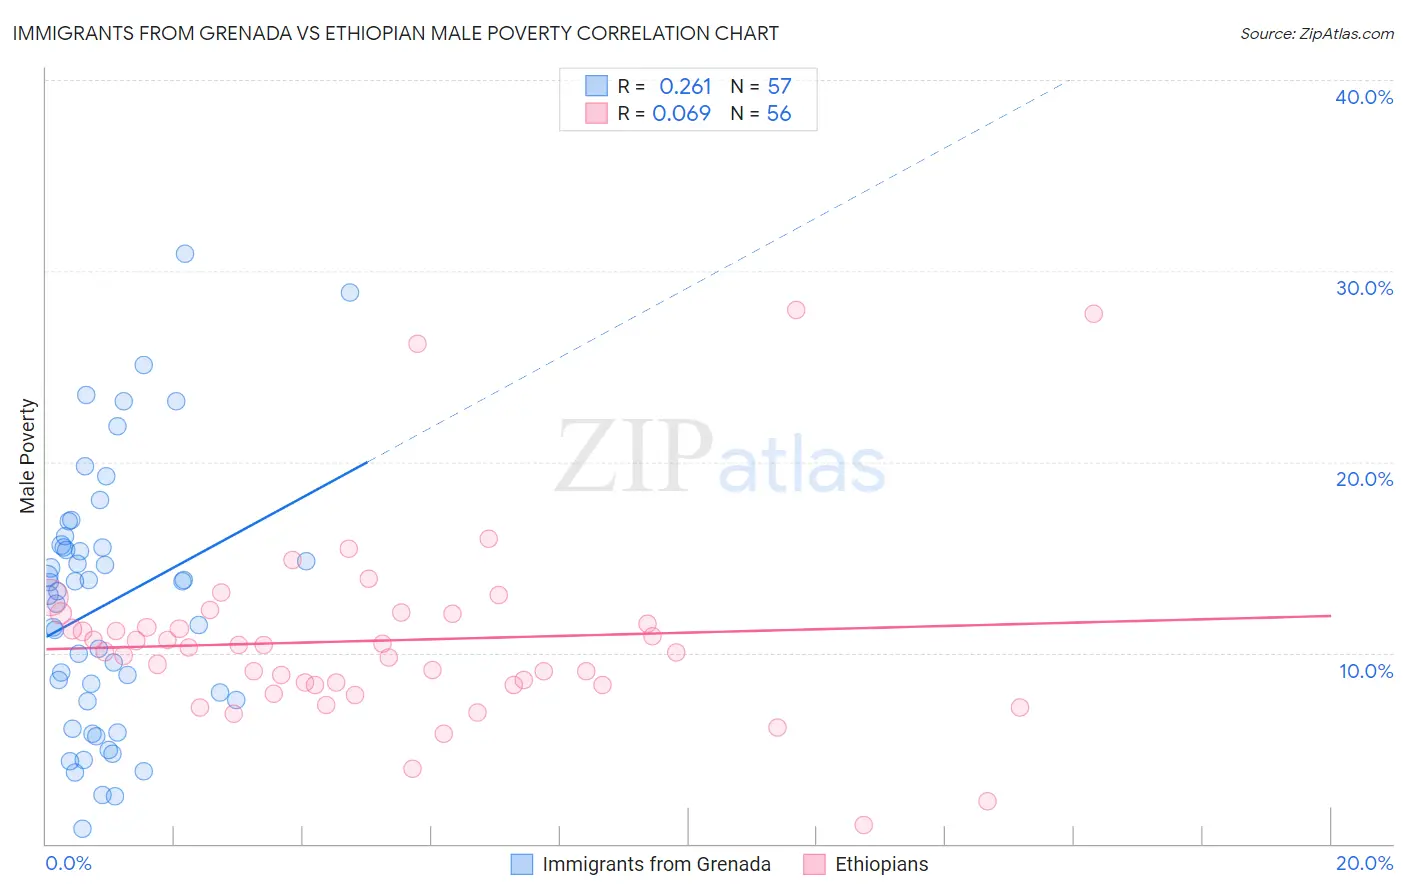
Immigrants from Grenada vs Ethiopian Male Poverty Correlation Chart
The statistical analysis conducted on geographies consisting of 67,181,242 people shows a weak positive correlation between the proportion of Immigrants from Grenada and poverty level among males in the United States with a correlation coefficient (R) of 0.261 and weighted average of 14.7%. Similarly, the statistical analysis conducted on geographies consisting of 223,096,222 people shows a slight positive correlation between the proportion of Ethiopians and poverty level among males in the United States with a correlation coefficient (R) of 0.069 and weighted average of 11.1%, a difference of 32.3%.
Male Poverty Correlation Summary
| Measurement | Immigrants from Grenada | Ethiopian |
| Minimum | 0.80% | 1.0% |
| Maximum | 30.9% | 28.0% |
| Range | 30.1% | 27.0% |
| Mean | 12.6% | 10.6% |
| Median | 13.2% | 10.2% |
| Interquartile 25% (IQ1) | 7.5% | 8.3% |
| Interquartile 75% (IQ3) | 15.6% | 11.8% |
| Interquartile Range (IQR) | 8.1% | 3.5% |
| Standard Deviation (Sample) | 6.7% | 4.9% |
| Standard Deviation (Population) | 6.7% | 4.9% |
Similar Demographics by Male Poverty
Demographics Similar to Immigrants from Grenada by Male Poverty
In terms of male poverty, the demographic groups most similar to Immigrants from Grenada are U.S. Virgin Islander (14.7%, a difference of 0.030%), Immigrants from Dominica (14.7%, a difference of 0.060%), Immigrants from Congo (14.7%, a difference of 0.12%), British West Indian (14.6%, a difference of 0.74%), and Chippewa (14.6%, a difference of 0.76%).
| Demographics | Rating | Rank | Male Poverty |
| Hondurans | 0.0 /100 | #311 | Tragic 14.3% |
| Choctaw | 0.0 /100 | #312 | Tragic 14.4% |
| Immigrants | Somalia | 0.0 /100 | #313 | Tragic 14.6% |
| Immigrants | Honduras | 0.0 /100 | #314 | Tragic 14.6% |
| Chippewa | 0.0 /100 | #315 | Tragic 14.6% |
| British West Indians | 0.0 /100 | #316 | Tragic 14.6% |
| Immigrants | Dominica | 0.0 /100 | #317 | Tragic 14.7% |
| Immigrants | Grenada | 0.0 /100 | #318 | Tragic 14.7% |
| U.S. Virgin Islanders | 0.0 /100 | #319 | Tragic 14.7% |
| Immigrants | Congo | 0.0 /100 | #320 | Tragic 14.7% |
| Arapaho | 0.0 /100 | #321 | Tragic 15.1% |
| Kiowa | 0.0 /100 | #322 | Tragic 15.2% |
| Colville | 0.0 /100 | #323 | Tragic 15.2% |
| Menominee | 0.0 /100 | #324 | Tragic 15.3% |
| Yakama | 0.0 /100 | #325 | Tragic 15.3% |
Demographics Similar to Ethiopians by Male Poverty
In terms of male poverty, the demographic groups most similar to Ethiopians are White/Caucasian (11.1%, a difference of 0.010%), Immigrants from Chile (11.1%, a difference of 0.070%), Immigrants from Spain (11.1%, a difference of 0.12%), Immigrants from Albania (11.1%, a difference of 0.14%), and Hungarian (11.1%, a difference of 0.16%).
| Demographics | Rating | Rank | Male Poverty |
| Scotch-Irish | 63.7 /100 | #157 | Good 11.0% |
| Colombians | 63.0 /100 | #158 | Good 11.0% |
| Taiwanese | 62.7 /100 | #159 | Good 11.0% |
| Soviet Union | 60.3 /100 | #160 | Good 11.1% |
| Immigrants | Northern Africa | 59.7 /100 | #161 | Average 11.1% |
| Immigrants | Chile | 57.4 /100 | #162 | Average 11.1% |
| Whites/Caucasians | 56.7 /100 | #163 | Average 11.1% |
| Ethiopians | 56.7 /100 | #164 | Average 11.1% |
| Immigrants | Spain | 55.5 /100 | #165 | Average 11.1% |
| Immigrants | Albania | 55.3 /100 | #166 | Average 11.1% |
| Hungarians | 55.1 /100 | #167 | Average 11.1% |
| Immigrants | Portugal | 54.9 /100 | #168 | Average 11.1% |
| Immigrants | Colombia | 54.2 /100 | #169 | Average 11.1% |
| South Americans | 53.8 /100 | #170 | Average 11.1% |
| Uruguayans | 51.0 /100 | #171 | Average 11.2% |