Immigrants from Russia vs Immigrants from Haiti Single Father Poverty

COMPARE

Immigrants from Russia
Race
Ancestry
AfghanAfricanAlaska NativeAlaskan AthabascanAlbanianAleutAlsatianAmericanApacheArabArapahoArgentineanArmenianAssyrian/Chaldean/SyriacAustralianAustrianBahamianBangladeshiBarbadianBasqueBelgianBelizeanBermudanBhutaneseBlackfeetBolivianBrazilianBritishBritish West IndianBulgarianBurmeseCajunCambodianCanadianCape VerdeanCarpatho RusynCelticCentral AmericanCentral American IndianCherokeeCheyenneChickasawChileanChineseChippewaChoctawColombianColvilleComancheCosta RicanCreeCreekCroatianCrowCubanCypriotCzechCzechoslovakianDanishDelawareDominicanDutchDutch West IndianEastern EuropeanEcuadorianEgyptianEnglishEstonianEthiopianEuropeanFijianFilipinoFinnishFrenchFrench American IndianFrench CanadianGermanGerman RussianGhanaianGreekGuamanian/ChamorroGuatemalanGuyaneseHaitianHmongHonduranHopiHoumaHungarianIcelanderIndian (Asian)IndonesianInupiatIranianIraqiIrishIroquoisIsraeliItalianJamaicanJapaneseJordanianKenyanKiowaKoreanLaotianLatvianLebaneseLiberianLithuanianLumbeeLuxembourgerMacedonianMalaysianMalteseMarshalleseMenomineeMexicanMexican American IndianMongolianMoroccanNative HawaiianNavajoNepaleseNew ZealanderNicaraguanNigerianNorthern EuropeanNorwegianOkinawanOsageOttawaPaiutePakistaniPalestinianPanamanianParaguayanPennsylvania GermanPeruvianPimaPolishPortuguesePotawatomiPuebloPuerto RicanPuget Sound SalishRomanianRussianSalvadoranSamoanScandinavianScotch-IrishScottishSeminoleSenegaleseSerbianShoshoneSierra LeoneanSiouxSlavicSlovakSloveneSomaliSouth AfricanSouth AmericanSouth American IndianSoviet UnionSpaniardSpanishSpanish AmericanSpanish American IndianSri LankanSubsaharan AfricanSudaneseSwedishSwissSyrianTaiwaneseThaiTlingit-HaidaTohono O'OdhamTonganTrinidadian and TobagonianTsimshianTurkishU.S. Virgin IslanderUgandanUkrainianUruguayanUteVenezuelanVietnameseWelshWest IndianYakamaYaquiYugoslavianYumanYup'ikZimbabwean
Immigration
NonimmigrantsImmigrantsAfghanistanAfricaAlbaniaArgentinaArmeniaAsiaAustraliaAustriaBahamasBangladeshBarbadosBelarusBelgiumBelizeBoliviaBosnia and HerzegovinaBrazilBulgariaBurma/MyanmarCabo VerdeCambodiaCameroonCanadaCaribbeanCentral AmericaChileChinaColombiaCongoCosta RicaCroatiaCubaCzechoslovakiaDenmarkDominicaDominican RepublicEastern AfricaEastern AsiaEastern EuropeEcuadorEgyptEl SalvadorEnglandEritreaEthiopiaEuropeFijiFranceGermanyGhanaGreeceGrenadaGuatemalaGuyanaHondurasHong KongHungaryIndiaIndonesiaIranIraqIrelandIsraelItalyJamaicaJapanJordanKazakhstanKenyaKoreaKuwaitLaosLatin AmericaLatviaLebanonLiberiaLithuaniaMalaysiaMexicoMicronesiaMiddle AfricaMoldovaMoroccoNepalNetherlandsNicaraguaNigeriaNorth AmericaNorth MacedoniaNorthern AfricaNorthern EuropeNorwayOceaniaPakistanPanamaPeruPhilippinesPolandPortugalRomaniaRussiaSaudi ArabiaScotlandSenegalSerbiaSierra LeoneSingaporeSomaliaSouth AfricaSouth AmericaSouth Central AsiaSouth Eastern AsiaSouthern EuropeSpainSri LankaSt. Vincent and the GrenadinesSudanSwedenSwitzerlandSyriaTaiwanThailandTrinidad and TobagoTurkeyUgandaUkraineUruguayUzbekistanVenezuelaVietnamWest IndiesWestern AfricaWestern AsiaWestern EuropeYemenZaireZimbabweAzores
Immigrants from Haiti
Race
Ancestry
AfghanAfricanAlaska NativeAlaskan AthabascanAlbanianAleutAlsatianAmericanApacheArabArapahoArgentineanArmenianAssyrian/Chaldean/SyriacAustralianAustrianBahamianBangladeshiBarbadianBasqueBelgianBelizeanBermudanBhutaneseBlackfeetBolivianBrazilianBritishBritish West IndianBulgarianBurmeseCajunCambodianCanadianCape VerdeanCarpatho RusynCelticCentral AmericanCentral American IndianCherokeeCheyenneChickasawChileanChineseChippewaChoctawColombianColvilleComancheCosta RicanCreeCreekCroatianCrowCubanCypriotCzechCzechoslovakianDanishDelawareDominicanDutchDutch West IndianEastern EuropeanEcuadorianEgyptianEnglishEstonianEthiopianEuropeanFijianFilipinoFinnishFrenchFrench American IndianFrench CanadianGermanGerman RussianGhanaianGreekGuamanian/ChamorroGuatemalanGuyaneseHaitianHmongHonduranHopiHoumaHungarianIcelanderIndian (Asian)IndonesianInupiatIranianIraqiIrishIroquoisIsraeliItalianJamaicanJapaneseJordanianKenyanKiowaKoreanLaotianLatvianLebaneseLiberianLithuanianLumbeeLuxembourgerMacedonianMalaysianMalteseMarshalleseMenomineeMexicanMexican American IndianMongolianMoroccanNative HawaiianNavajoNepaleseNew ZealanderNicaraguanNigerianNorthern EuropeanNorwegianOkinawanOsageOttawaPaiutePakistaniPalestinianPanamanianParaguayanPennsylvania GermanPeruvianPimaPolishPortuguesePotawatomiPuebloPuerto RicanPuget Sound SalishRomanianRussianSalvadoranSamoanScandinavianScotch-IrishScottishSeminoleSenegaleseSerbianShoshoneSierra LeoneanSiouxSlavicSlovakSloveneSomaliSouth AfricanSouth AmericanSouth American IndianSoviet UnionSpaniardSpanishSpanish AmericanSpanish American IndianSri LankanSubsaharan AfricanSudaneseSwedishSwissSyrianTaiwaneseThaiTlingit-HaidaTohono O'OdhamTonganTrinidadian and TobagonianTsimshianTurkishU.S. Virgin IslanderUgandanUkrainianUruguayanUteVenezuelanVietnameseWelshWest IndianYakamaYaquiYugoslavianYumanYup'ikZimbabwean
Immigration
NonimmigrantsImmigrantsAfghanistanAfricaAlbaniaArgentinaArmeniaAsiaAustraliaAustriaBahamasBangladeshBarbadosBelarusBelgiumBelizeBoliviaBosnia and HerzegovinaBrazilBulgariaBurma/MyanmarCabo VerdeCambodiaCameroonCanadaCaribbeanCentral AmericaChileChinaColombiaCongoCosta RicaCroatiaCubaCzechoslovakiaDenmarkDominicaDominican RepublicEastern AfricaEastern AsiaEastern EuropeEcuadorEgyptEl SalvadorEnglandEritreaEthiopiaEuropeFijiFranceGermanyGhanaGreeceGrenadaGuatemalaGuyanaHaitiHondurasHong KongHungaryIndiaIndonesiaIranIraqIrelandIsraelItalyJamaicaJapanJordanKazakhstanKenyaKoreaKuwaitLaosLatin AmericaLatviaLebanonLiberiaLithuaniaMalaysiaMexicoMicronesiaMiddle AfricaMoldovaMoroccoNepalNetherlandsNicaraguaNigeriaNorth AmericaNorth MacedoniaNorthern AfricaNorthern EuropeNorwayOceaniaPakistanPanamaPeruPhilippinesPolandPortugalRomaniaSaudi ArabiaScotlandSenegalSerbiaSierra LeoneSingaporeSomaliaSouth AfricaSouth AmericaSouth Central AsiaSouth Eastern AsiaSouthern EuropeSpainSri LankaSt. Vincent and the GrenadinesSudanSwedenSwitzerlandSyriaTaiwanThailandTrinidad and TobagoTurkeyUgandaUkraineUruguayUzbekistanVenezuelaVietnamWest IndiesWestern AfricaWestern AsiaWestern EuropeYemenZaireZimbabweAzores
Single Father Poverty
Income
Poverty
Unemployment
Labor Participation
Family Structure
Vehicle Availability
Education Level
Disability

Single Father Poverty Comparison

Immigrants from Russia

Immigrants from Haiti

Exceptional
Tragic
15.5%
SINGLE FATHER POVERTY
99.0/ 100
METRIC RATING
86th/ 347
METRIC RANK
17.2%
SINGLE FATHER POVERTY
0.8/ 100
METRIC RATING
256th/ 347
METRIC RANK

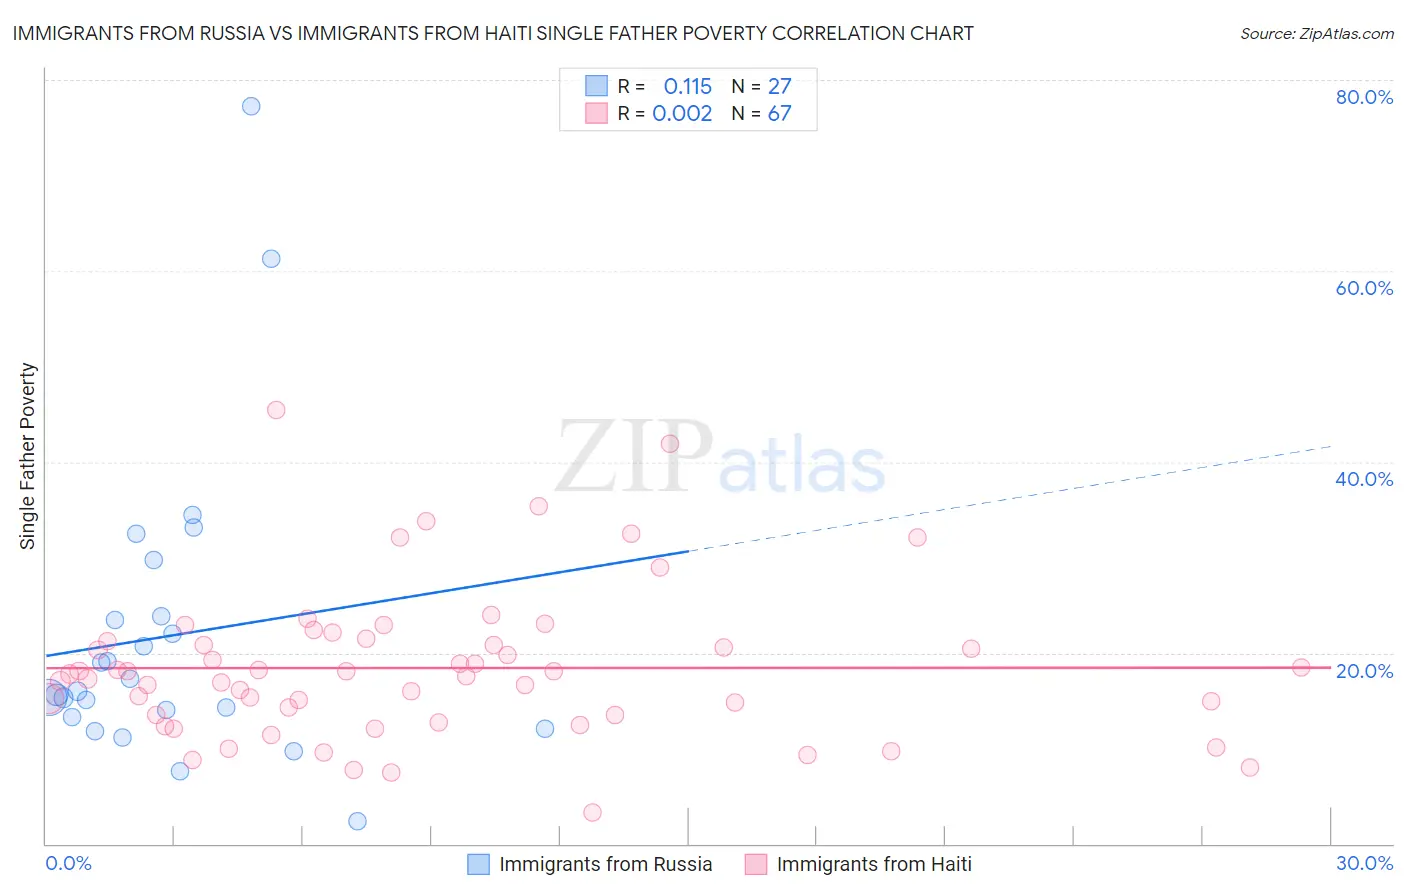
Immigrants from Russia vs Immigrants from Haiti Single Father Poverty Correlation Chart

The statistical analysis conducted on geographies consisting of 273,488,054 people shows a poor positive correlation between the proportion of Immigrants from Russia and poverty level among single fathers in the United States with a correlation coefficient (R) of 0.115 and weighted average of 15.5%. Similarly, the statistical analysis conducted on geographies consisting of 189,968,112 people shows no correlation between the proportion of Immigrants from Haiti and poverty level among single fathers in the United States with a correlation coefficient (R) of 0.002 and weighted average of 17.2%, a difference of 11.1%.
Immigrants from Russia vs Immigrants from Haiti Single Father Poverty

Single Father Poverty Correlation Summary

MeasurementImmigrants from RussiaImmigrants from Haiti
Minimum2.4%3.3%
Maximum77.3%45.4%
Range74.9%42.1%
Mean21.7%18.4%
Median15.9%17.8%
Interquartile 25% (IQ1)13.3%13.4%
Interquartile 75% (IQ3)23.9%21.2%
Interquartile Range (IQR)10.6%7.8%
Standard Deviation (Sample)15.9%7.9%
Standard Deviation (Population)15.6%7.8%

Similar Demographics by Single Father Poverty

Demographics Similar to Immigrants from Russia by Single Father Poverty

In terms of single father poverty, the demographic groups most similar to Immigrants from Russia are Brazilian (15.5%, a difference of 0.0%), Burmese (15.5%, a difference of 0.040%), Immigrants from Korea (15.5%, a difference of 0.10%), Immigrants from Oceania (15.4%, a difference of 0.12%), and Peruvian (15.4%, a difference of 0.24%).
DemographicsRating | RankSingle Father Poverty
Immigrants | Northern Africa
99.5
/100
|
#79
Exceptional
15.3%
Armenians
99.4
/100
|
#80
Exceptional
15.4%
Immigrants | Congo
99.4
/100
|
#81
Exceptional
15.4%
Immigrants | Ukraine
99.4
/100
|
#82
Exceptional
15.4%
Chinese
99.3
/100
|
#83
Exceptional
15.4%
Peruvians
99.2
/100
|
#84
Exceptional
15.4%
Immigrants | Oceania
99.1
/100
|
#85
Exceptional
15.4%
Immigrants | Russia
99.0
/100
|
#86
Exceptional
15.5%
Brazilians
99.0
/100
|
#87
Exceptional
15.5%
Burmese
99.0
/100
|
#88
Exceptional
15.5%
Immigrants | Korea
99.0
/100
|
#89
Exceptional
15.5%
Mexican American Indians
98.7
/100
|
#90
Exceptional
15.5%
Immigrants | Romania
98.6
/100
|
#91
Exceptional
15.5%
Immigrants | Serbia
98.5
/100
|
#92
Exceptional
15.5%
Basques
98.4
/100
|
#93
Exceptional
15.5%

Demographics Similar to Immigrants from Haiti by Single Father Poverty

In terms of single father poverty, the demographic groups most similar to Immigrants from Haiti are Sierra Leonean (17.2%, a difference of 0.010%), Immigrants from Albania (17.2%, a difference of 0.080%), Albanian (17.2%, a difference of 0.10%), Immigrants from Jamaica (17.2%, a difference of 0.13%), and Immigrants from Honduras (17.1%, a difference of 0.19%).
DemographicsRating | RankSingle Father Poverty
Canadians
1.3
/100
|
#249
Tragic
17.1%
Austrians
1.1
/100
|
#250
Tragic
17.1%
Luxembourgers
1.1
/100
|
#251
Tragic
17.1%
Croatians
1.0
/100
|
#252
Tragic
17.1%
Cree
1.0
/100
|
#253
Tragic
17.1%
Immigrants | Honduras
0.9
/100
|
#254
Tragic
17.1%
Sierra Leoneans
0.8
/100
|
#255
Tragic
17.2%
Immigrants | Haiti
0.8
/100
|
#256
Tragic
17.2%
Immigrants | Albania
0.7
/100
|
#257
Tragic
17.2%
Albanians
0.7
/100
|
#258
Tragic
17.2%
Immigrants | Jamaica
0.7
/100
|
#259
Tragic
17.2%
Spaniards
0.6
/100
|
#260
Tragic
17.2%
Swiss
0.5
/100
|
#261
Tragic
17.3%
Immigrants | Zaire
0.4
/100
|
#262
Tragic
17.3%
Lithuanians
0.4
/100
|
#263
Tragic
17.3%