Immigrants from Panama vs Immigrants from Australia Child Poverty Among Boys Under 16

COMPARE

Immigrants from Panama
Race
Ancestry
AfghanAfricanAlaska NativeAlaskan AthabascanAlbanianAleutAlsatianAmericanApacheArabArapahoArgentineanArmenianAssyrian/Chaldean/SyriacAustralianAustrianBahamianBangladeshiBarbadianBasqueBelgianBelizeanBermudanBhutaneseBlackfeetBolivianBrazilianBritishBritish West IndianBulgarianBurmeseCajunCambodianCanadianCape VerdeanCarpatho RusynCelticCentral AmericanCentral American IndianCherokeeCheyenneChickasawChileanChineseChippewaChoctawColombianColvilleComancheCosta RicanCreeCreekCroatianCrowCubanCypriotCzechCzechoslovakianDanishDelawareDominicanDutchDutch West IndianEastern EuropeanEcuadorianEgyptianEnglishEstonianEthiopianEuropeanFijianFilipinoFinnishFrenchFrench American IndianFrench CanadianGermanGerman RussianGhanaianGreekGuamanian/ChamorroGuatemalanGuyaneseHaitianHmongHonduranHopiHoumaHungarianIcelanderIndian (Asian)IndonesianInupiatIranianIraqiIrishIroquoisIsraeliItalianJamaicanJapaneseJordanianKenyanKiowaKoreanLaotianLatvianLebaneseLiberianLithuanianLumbeeLuxembourgerMacedonianMalaysianMalteseMarshalleseMenomineeMexicanMexican American IndianMongolianMoroccanNative HawaiianNavajoNepaleseNew ZealanderNicaraguanNigerianNorthern EuropeanNorwegianOkinawanOsageOttawaPaiutePakistaniPalestinianPanamanianParaguayanPennsylvania GermanPeruvianPimaPolishPortuguesePotawatomiPuebloPuerto RicanPuget Sound SalishRomanianRussianSalvadoranSamoanScandinavianScotch-IrishScottishSeminoleSenegaleseSerbianShoshoneSierra LeoneanSiouxSlavicSlovakSloveneSomaliSouth AfricanSouth AmericanSouth American IndianSoviet UnionSpaniardSpanishSpanish AmericanSpanish American IndianSri LankanSubsaharan AfricanSudaneseSwedishSwissSyrianTaiwaneseThaiTlingit-HaidaTohono O'OdhamTonganTrinidadian and TobagonianTsimshianTurkishU.S. Virgin IslanderUgandanUkrainianUruguayanUteVenezuelanVietnameseWelshWest IndianYakamaYaquiYugoslavianYumanYup'ikZimbabwean
Immigration
NonimmigrantsImmigrantsAfghanistanAfricaAlbaniaArgentinaArmeniaAsiaAustriaBahamasBangladeshBarbadosBelarusBelgiumBelizeBoliviaBosnia and HerzegovinaBrazilBulgariaBurma/MyanmarCabo VerdeCambodiaCameroonCanadaCaribbeanCentral AmericaChileChinaColombiaCongoCosta RicaCroatiaCubaCzechoslovakiaDenmarkDominicaDominican RepublicEastern AfricaEastern AsiaEastern EuropeEcuadorEgyptEl SalvadorEnglandEritreaEthiopiaEuropeFijiFranceGermanyGhanaGreeceGrenadaGuatemalaGuyanaHaitiHondurasHong KongHungaryIndiaIndonesiaIranIraqIrelandIsraelItalyJamaicaJapanJordanKazakhstanKenyaKoreaKuwaitLaosLatin AmericaLatviaLebanonLiberiaLithuaniaMalaysiaMexicoMicronesiaMiddle AfricaMoldovaMoroccoNepalNetherlandsNicaraguaNigeriaNorth AmericaNorth MacedoniaNorthern AfricaNorthern EuropeNorwayOceaniaPakistanPanamaPeruPhilippinesPolandPortugalRomaniaRussiaSaudi ArabiaScotlandSenegalSerbiaSierra LeoneSingaporeSomaliaSouth AfricaSouth AmericaSouth Central AsiaSouth Eastern AsiaSouthern EuropeSpainSri LankaSt. Vincent and the GrenadinesSudanSwedenSwitzerlandSyriaTaiwanThailandTrinidad and TobagoTurkeyUgandaUkraineUruguayUzbekistanVenezuelaVietnamWest IndiesWestern AfricaWestern AsiaWestern EuropeYemenZaireZimbabweAzores
Immigrants from Australia
Race
Ancestry
AfghanAfricanAlaska NativeAlaskan AthabascanAlbanianAleutAlsatianAmericanApacheArabArapahoArgentineanArmenianAssyrian/Chaldean/SyriacAustralianAustrianBahamianBangladeshiBarbadianBasqueBelgianBelizeanBermudanBhutaneseBlackfeetBolivianBrazilianBritishBritish West IndianBulgarianBurmeseCajunCambodianCanadianCape VerdeanCarpatho RusynCelticCentral AmericanCentral American IndianCherokeeCheyenneChickasawChileanChineseChippewaChoctawColombianColvilleComancheCosta RicanCreeCreekCroatianCrowCubanCypriotCzechCzechoslovakianDanishDelawareDominicanDutchDutch West IndianEastern EuropeanEcuadorianEgyptianEnglishEstonianEthiopianEuropeanFijianFilipinoFinnishFrenchFrench American IndianFrench CanadianGermanGerman RussianGhanaianGreekGuamanian/ChamorroGuatemalanGuyaneseHaitianHmongHonduranHopiHoumaHungarianIcelanderIndian (Asian)IndonesianInupiatIranianIraqiIrishIroquoisIsraeliItalianJamaicanJapaneseJordanianKenyanKiowaKoreanLaotianLatvianLebaneseLiberianLithuanianLumbeeLuxembourgerMacedonianMalaysianMalteseMarshalleseMenomineeMexicanMexican American IndianMongolianMoroccanNative HawaiianNavajoNepaleseNew ZealanderNicaraguanNigerianNorthern EuropeanNorwegianOkinawanOsageOttawaPaiutePakistaniPalestinianPanamanianParaguayanPennsylvania GermanPeruvianPimaPolishPortuguesePotawatomiPuebloPuerto RicanPuget Sound SalishRomanianRussianSalvadoranSamoanScandinavianScotch-IrishScottishSeminoleSenegaleseSerbianShoshoneSierra LeoneanSiouxSlavicSlovakSloveneSomaliSouth AfricanSouth AmericanSouth American IndianSoviet UnionSpaniardSpanishSpanish AmericanSpanish American IndianSri LankanSubsaharan AfricanSudaneseSwedishSwissSyrianTaiwaneseThaiTlingit-HaidaTohono O'OdhamTonganTrinidadian and TobagonianTsimshianTurkishU.S. Virgin IslanderUgandanUkrainianUruguayanUteVenezuelanVietnameseWelshWest IndianYakamaYaquiYugoslavianYumanYup'ikZimbabwean
Immigration
NonimmigrantsImmigrantsAfghanistanAfricaAlbaniaArgentinaArmeniaAsiaAustraliaAustriaBahamasBangladeshBarbadosBelarusBelgiumBelizeBoliviaBosnia and HerzegovinaBrazilBulgariaBurma/MyanmarCabo VerdeCambodiaCameroonCanadaCaribbeanCentral AmericaChileChinaColombiaCongoCosta RicaCroatiaCubaCzechoslovakiaDenmarkDominicaDominican RepublicEastern AfricaEastern AsiaEastern EuropeEcuadorEgyptEl SalvadorEnglandEritreaEthiopiaEuropeFijiFranceGermanyGhanaGreeceGrenadaGuatemalaGuyanaHaitiHondurasHong KongHungaryIndiaIndonesiaIranIraqIrelandIsraelItalyJamaicaJapanJordanKazakhstanKenyaKoreaKuwaitLaosLatin AmericaLatviaLebanonLiberiaLithuaniaMalaysiaMexicoMicronesiaMiddle AfricaMoldovaMoroccoNepalNetherlandsNicaraguaNigeriaNorth AmericaNorth MacedoniaNorthern AfricaNorthern EuropeNorwayOceaniaPakistanPeruPhilippinesPolandPortugalRomaniaRussiaSaudi ArabiaScotlandSenegalSerbiaSierra LeoneSingaporeSomaliaSouth AfricaSouth AmericaSouth Central AsiaSouth Eastern AsiaSouthern EuropeSpainSri LankaSt. Vincent and the GrenadinesSudanSwedenSwitzerlandSyriaTaiwanThailandTrinidad and TobagoTurkeyUgandaUkraineUruguayUzbekistanVenezuelaVietnamWest IndiesWestern AfricaWestern AsiaWestern EuropeYemenZaireZimbabweAzores
Child Poverty Among Boys Under 16
Income
Poverty
Unemployment
Labor Participation
Family Structure
Vehicle Availability
Education Level
Disability

Child Poverty Among Boys Under 16 Comparison

Immigrants from Panama

Immigrants from Australia

Tragic
Exceptional
17.9%
CHILD POVERTY AMONG BOYS UNDER 16
4.3/ 100
METRIC RATING
221st/ 347
METRIC RANK
13.9%
CHILD POVERTY AMONG BOYS UNDER 16
99.6/ 100
METRIC RATING
39th/ 347
METRIC RANK

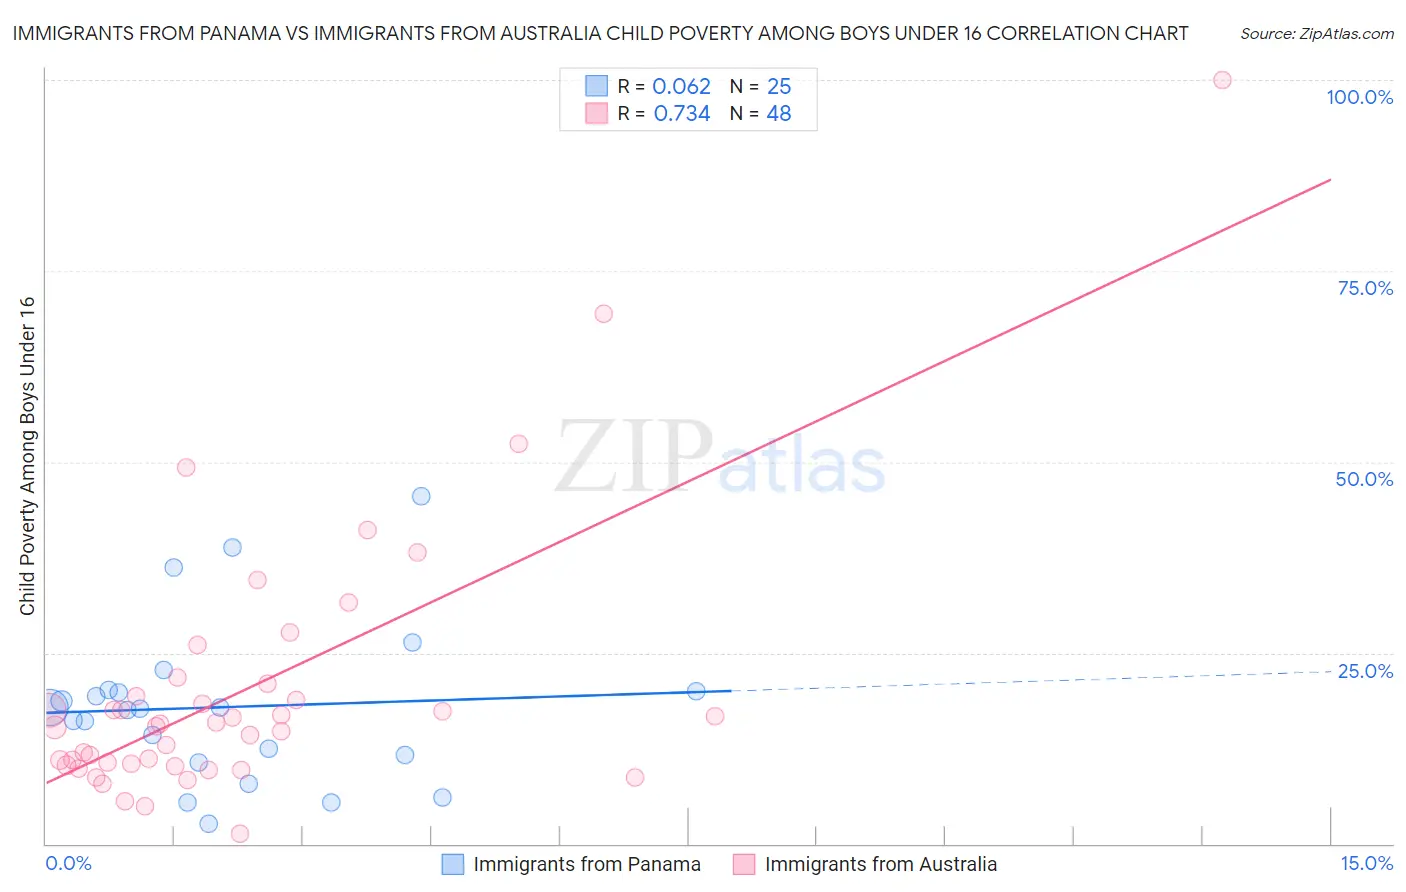
Immigrants from Panama vs Immigrants from Australia Child Poverty Among Boys Under 16 Correlation Chart

The statistical analysis conducted on geographies consisting of 219,900,971 people shows a slight positive correlation between the proportion of Immigrants from Panama and poverty level among boys under the age of 16 in the United States with a correlation coefficient (R) of 0.062 and weighted average of 17.9%. Similarly, the statistical analysis conducted on geographies consisting of 224,146,176 people shows a strong positive correlation between the proportion of Immigrants from Australia and poverty level among boys under the age of 16 in the United States with a correlation coefficient (R) of 0.734 and weighted average of 13.9%, a difference of 28.4%.
Immigrants from Panama vs Immigrants from Australia Child Poverty Among Boys Under 16

Child Poverty Among Boys Under 16 Correlation Summary

MeasurementImmigrants from PanamaImmigrants from Australia
Minimum2.7%1.3%
Maximum45.5%100.0%
Range42.8%98.7%
Mean17.9%20.1%
Median17.7%15.6%
Interquartile 25% (IQ1)11.1%10.4%
Interquartile 75% (IQ3)20.1%20.1%
Interquartile Range (IQR)8.9%9.7%
Standard Deviation (Sample)10.3%17.6%
Standard Deviation (Population)10.1%17.4%

Similar Demographics by Child Poverty Among Boys Under 16

Demographics Similar to Immigrants from Panama by Child Poverty Among Boys Under 16

In terms of child poverty among boys under 16, the demographic groups most similar to Immigrants from Panama are Pennsylvania German (17.9%, a difference of 0.23%), Cuban (17.9%, a difference of 0.32%), Immigrants from Cambodia (17.8%, a difference of 0.47%), Sierra Leonean (17.8%, a difference of 0.60%), and Iraqi (17.7%, a difference of 0.68%).
DemographicsRating | RankChild Poverty Among Boys Under 16
Panamanians
5.9
/100
|
#214
Tragic
17.7%
Osage
5.8
/100
|
#215
Tragic
17.7%
Moroccans
5.6
/100
|
#216
Tragic
17.7%
Japanese
5.5
/100
|
#217
Tragic
17.7%
Iraqis
5.5
/100
|
#218
Tragic
17.7%
Sierra Leoneans
5.3
/100
|
#219
Tragic
17.8%
Immigrants | Cambodia
5.1
/100
|
#220
Tragic
17.8%
Immigrants | Panama
4.3
/100
|
#221
Tragic
17.9%
Pennsylvania Germans
3.9
/100
|
#222
Tragic
17.9%
Cubans
3.8
/100
|
#223
Tragic
17.9%
Nepalese
3.2
/100
|
#224
Tragic
18.0%
Inupiat
2.7
/100
|
#225
Tragic
18.1%
Immigrants | Africa
2.6
/100
|
#226
Tragic
18.1%
Bermudans
2.5
/100
|
#227
Tragic
18.1%
Immigrants | Nonimmigrants
2.2
/100
|
#228
Tragic
18.2%

Demographics Similar to Immigrants from Australia by Child Poverty Among Boys Under 16

In terms of child poverty among boys under 16, the demographic groups most similar to Immigrants from Australia are Immigrants from Northern Europe (13.9%, a difference of 0.14%), Immigrants from Asia (13.9%, a difference of 0.24%), Immigrants from Sri Lanka (13.9%, a difference of 0.28%), Lithuanian (14.0%, a difference of 0.33%), and Korean (14.0%, a difference of 0.36%).
DemographicsRating | RankChild Poverty Among Boys Under 16
Immigrants | China
99.8
/100
|
#32
Exceptional
13.6%
Danes
99.8
/100
|
#33
Exceptional
13.6%
Assyrians/Chaldeans/Syriacs
99.8
/100
|
#34
Exceptional
13.6%
Russians
99.7
/100
|
#35
Exceptional
13.8%
Luxembourgers
99.7
/100
|
#36
Exceptional
13.8%
Immigrants | Sri Lanka
99.6
/100
|
#37
Exceptional
13.9%
Immigrants | Northern Europe
99.6
/100
|
#38
Exceptional
13.9%
Immigrants | Australia
99.6
/100
|
#39
Exceptional
13.9%
Immigrants | Asia
99.6
/100
|
#40
Exceptional
13.9%
Lithuanians
99.6
/100
|
#41
Exceptional
14.0%
Koreans
99.6
/100
|
#42
Exceptional
14.0%
Croatians
99.5
/100
|
#43
Exceptional
14.0%
Estonians
99.4
/100
|
#44
Exceptional
14.1%
Immigrants | Scotland
99.4
/100
|
#45
Exceptional
14.1%
Greeks
99.4
/100
|
#46
Exceptional
14.1%