Immigrants from Morocco vs Immigrants from Australia Child Poverty Among Boys Under 16

COMPARE

Immigrants from Morocco
Race
Ancestry
AfghanAfricanAlaska NativeAlaskan AthabascanAlbanianAleutAlsatianAmericanApacheArabArapahoArgentineanArmenianAssyrian/Chaldean/SyriacAustralianAustrianBahamianBangladeshiBarbadianBasqueBelgianBelizeanBermudanBhutaneseBlackfeetBolivianBrazilianBritishBritish West IndianBulgarianBurmeseCajunCambodianCanadianCape VerdeanCarpatho RusynCelticCentral AmericanCentral American IndianCherokeeCheyenneChickasawChileanChineseChippewaChoctawColombianColvilleComancheCosta RicanCreeCreekCroatianCrowCubanCypriotCzechCzechoslovakianDanishDelawareDominicanDutchDutch West IndianEastern EuropeanEcuadorianEgyptianEnglishEstonianEthiopianEuropeanFijianFilipinoFinnishFrenchFrench American IndianFrench CanadianGermanGerman RussianGhanaianGreekGuamanian/ChamorroGuatemalanGuyaneseHaitianHmongHonduranHopiHoumaHungarianIcelanderIndian (Asian)IndonesianInupiatIranianIraqiIrishIroquoisIsraeliItalianJamaicanJapaneseJordanianKenyanKiowaKoreanLaotianLatvianLebaneseLiberianLithuanianLumbeeLuxembourgerMacedonianMalaysianMalteseMarshalleseMenomineeMexicanMexican American IndianMongolianMoroccanNative HawaiianNavajoNepaleseNew ZealanderNicaraguanNigerianNorthern EuropeanNorwegianOkinawanOsageOttawaPaiutePakistaniPalestinianPanamanianParaguayanPennsylvania GermanPeruvianPimaPolishPortuguesePotawatomiPuebloPuerto RicanPuget Sound SalishRomanianRussianSalvadoranSamoanScandinavianScotch-IrishScottishSeminoleSenegaleseSerbianShoshoneSierra LeoneanSiouxSlavicSlovakSloveneSomaliSouth AfricanSouth AmericanSouth American IndianSoviet UnionSpaniardSpanishSpanish AmericanSpanish American IndianSri LankanSubsaharan AfricanSudaneseSwedishSwissSyrianTaiwaneseThaiTlingit-HaidaTohono O'OdhamTonganTrinidadian and TobagonianTsimshianTurkishU.S. Virgin IslanderUgandanUkrainianUruguayanUteVenezuelanVietnameseWelshWest IndianYakamaYaquiYugoslavianYumanYup'ikZimbabwean
Immigration
NonimmigrantsImmigrantsAfghanistanAfricaAlbaniaArgentinaArmeniaAsiaAustriaBahamasBangladeshBarbadosBelarusBelgiumBelizeBoliviaBosnia and HerzegovinaBrazilBulgariaBurma/MyanmarCabo VerdeCambodiaCameroonCanadaCaribbeanCentral AmericaChileChinaColombiaCongoCosta RicaCroatiaCubaCzechoslovakiaDenmarkDominicaDominican RepublicEastern AfricaEastern AsiaEastern EuropeEcuadorEgyptEl SalvadorEnglandEritreaEthiopiaEuropeFijiFranceGermanyGhanaGreeceGrenadaGuatemalaGuyanaHaitiHondurasHong KongHungaryIndiaIndonesiaIranIraqIrelandIsraelItalyJamaicaJapanJordanKazakhstanKenyaKoreaKuwaitLaosLatin AmericaLatviaLebanonLiberiaLithuaniaMalaysiaMexicoMicronesiaMiddle AfricaMoldovaMoroccoNepalNetherlandsNicaraguaNigeriaNorth AmericaNorth MacedoniaNorthern AfricaNorthern EuropeNorwayOceaniaPakistanPanamaPeruPhilippinesPolandPortugalRomaniaRussiaSaudi ArabiaScotlandSenegalSerbiaSierra LeoneSingaporeSomaliaSouth AfricaSouth AmericaSouth Central AsiaSouth Eastern AsiaSouthern EuropeSpainSri LankaSt. Vincent and the GrenadinesSudanSwedenSwitzerlandSyriaTaiwanThailandTrinidad and TobagoTurkeyUgandaUkraineUruguayUzbekistanVenezuelaVietnamWest IndiesWestern AfricaWestern AsiaWestern EuropeYemenZaireZimbabweAzores
Immigrants from Australia
Race
Ancestry
AfghanAfricanAlaska NativeAlaskan AthabascanAlbanianAleutAlsatianAmericanApacheArabArapahoArgentineanArmenianAssyrian/Chaldean/SyriacAustralianAustrianBahamianBangladeshiBarbadianBasqueBelgianBelizeanBermudanBhutaneseBlackfeetBolivianBrazilianBritishBritish West IndianBulgarianBurmeseCajunCambodianCanadianCape VerdeanCarpatho RusynCelticCentral AmericanCentral American IndianCherokeeCheyenneChickasawChileanChineseChippewaChoctawColombianColvilleComancheCosta RicanCreeCreekCroatianCrowCubanCypriotCzechCzechoslovakianDanishDelawareDominicanDutchDutch West IndianEastern EuropeanEcuadorianEgyptianEnglishEstonianEthiopianEuropeanFijianFilipinoFinnishFrenchFrench American IndianFrench CanadianGermanGerman RussianGhanaianGreekGuamanian/ChamorroGuatemalanGuyaneseHaitianHmongHonduranHopiHoumaHungarianIcelanderIndian (Asian)IndonesianInupiatIranianIraqiIrishIroquoisIsraeliItalianJamaicanJapaneseJordanianKenyanKiowaKoreanLaotianLatvianLebaneseLiberianLithuanianLumbeeLuxembourgerMacedonianMalaysianMalteseMarshalleseMenomineeMexicanMexican American IndianMongolianMoroccanNative HawaiianNavajoNepaleseNew ZealanderNicaraguanNigerianNorthern EuropeanNorwegianOkinawanOsageOttawaPaiutePakistaniPalestinianPanamanianParaguayanPennsylvania GermanPeruvianPimaPolishPortuguesePotawatomiPuebloPuerto RicanPuget Sound SalishRomanianRussianSalvadoranSamoanScandinavianScotch-IrishScottishSeminoleSenegaleseSerbianShoshoneSierra LeoneanSiouxSlavicSlovakSloveneSomaliSouth AfricanSouth AmericanSouth American IndianSoviet UnionSpaniardSpanishSpanish AmericanSpanish American IndianSri LankanSubsaharan AfricanSudaneseSwedishSwissSyrianTaiwaneseThaiTlingit-HaidaTohono O'OdhamTonganTrinidadian and TobagonianTsimshianTurkishU.S. Virgin IslanderUgandanUkrainianUruguayanUteVenezuelanVietnameseWelshWest IndianYakamaYaquiYugoslavianYumanYup'ikZimbabwean
Immigration
NonimmigrantsImmigrantsAfghanistanAfricaAlbaniaArgentinaArmeniaAsiaAustraliaAustriaBahamasBangladeshBarbadosBelarusBelgiumBelizeBoliviaBosnia and HerzegovinaBrazilBulgariaBurma/MyanmarCabo VerdeCambodiaCameroonCanadaCaribbeanCentral AmericaChileChinaColombiaCongoCosta RicaCroatiaCubaCzechoslovakiaDenmarkDominicaDominican RepublicEastern AfricaEastern AsiaEastern EuropeEcuadorEgyptEl SalvadorEnglandEritreaEthiopiaEuropeFijiFranceGermanyGhanaGreeceGrenadaGuatemalaGuyanaHaitiHondurasHong KongHungaryIndiaIndonesiaIranIraqIrelandIsraelItalyJamaicaJapanJordanKazakhstanKenyaKoreaKuwaitLaosLatin AmericaLatviaLebanonLiberiaLithuaniaMalaysiaMexicoMicronesiaMiddle AfricaMoldovaNepalNetherlandsNicaraguaNigeriaNorth AmericaNorth MacedoniaNorthern AfricaNorthern EuropeNorwayOceaniaPakistanPanamaPeruPhilippinesPolandPortugalRomaniaRussiaSaudi ArabiaScotlandSenegalSerbiaSierra LeoneSingaporeSomaliaSouth AfricaSouth AmericaSouth Central AsiaSouth Eastern AsiaSouthern EuropeSpainSri LankaSt. Vincent and the GrenadinesSudanSwedenSwitzerlandSyriaTaiwanThailandTrinidad and TobagoTurkeyUgandaUkraineUruguayUzbekistanVenezuelaVietnamWest IndiesWestern AfricaWestern AsiaWestern EuropeYemenZaireZimbabweAzores
Child Poverty Among Boys Under 16
Income
Poverty
Unemployment
Labor Participation
Family Structure
Vehicle Availability
Education Level
Disability

Child Poverty Among Boys Under 16 Comparison

Immigrants from Morocco

Immigrants from Australia

Fair
Exceptional
16.7%
CHILD POVERTY AMONG BOYS UNDER 16
34.5/ 100
METRIC RATING
189th/ 347
METRIC RANK
13.9%
CHILD POVERTY AMONG BOYS UNDER 16
99.6/ 100
METRIC RATING
39th/ 347
METRIC RANK

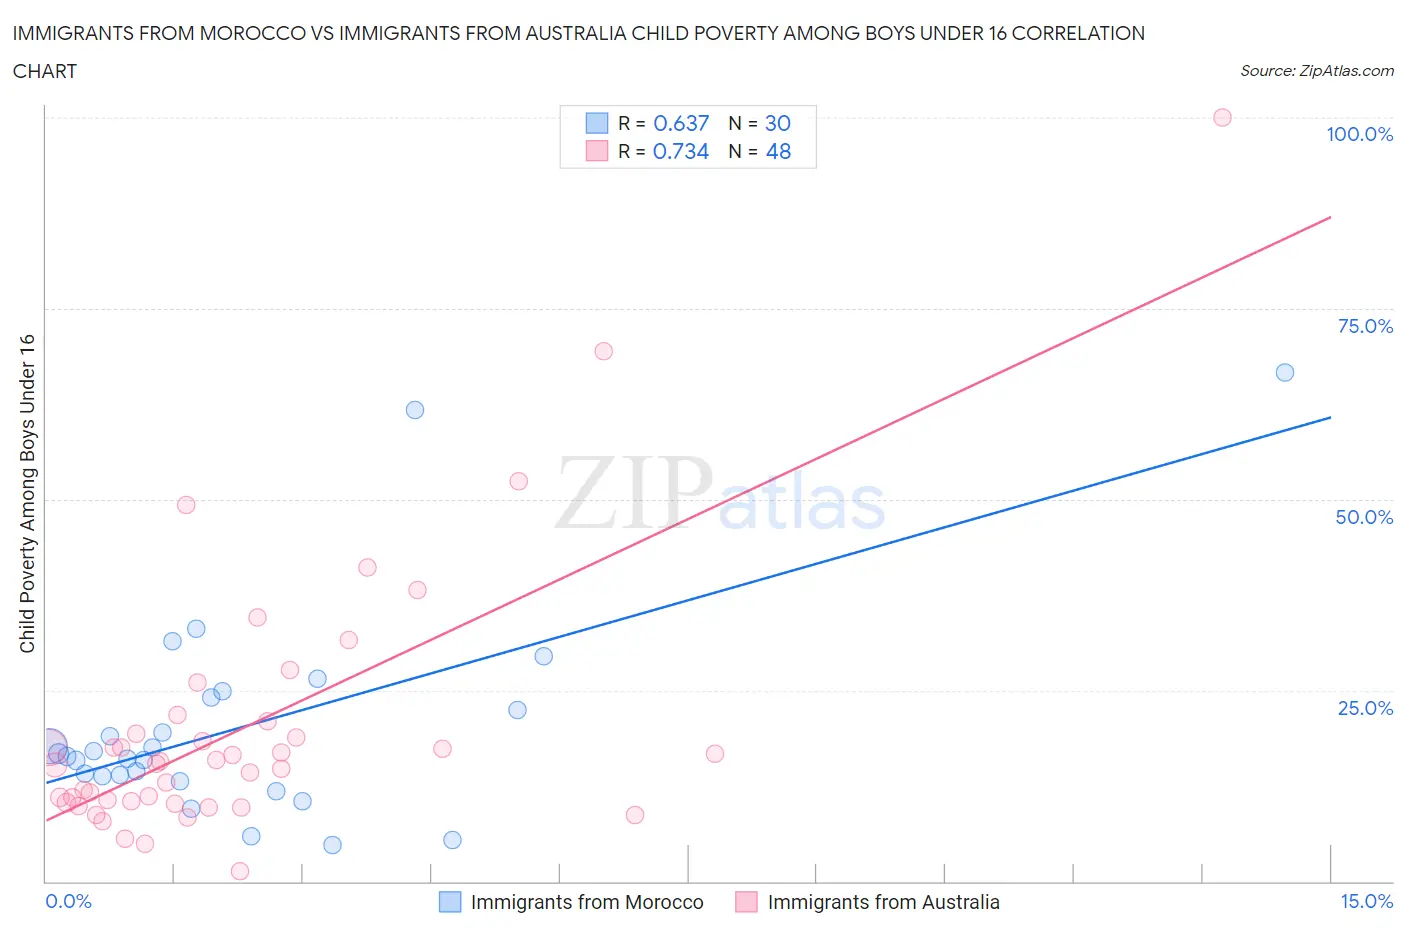
Immigrants from Morocco vs Immigrants from Australia Child Poverty Among Boys Under 16 Correlation Chart

The statistical analysis conducted on geographies consisting of 177,812,919 people shows a significant positive correlation between the proportion of Immigrants from Morocco and poverty level among boys under the age of 16 in the United States with a correlation coefficient (R) of 0.637 and weighted average of 16.7%. Similarly, the statistical analysis conducted on geographies consisting of 224,146,176 people shows a strong positive correlation between the proportion of Immigrants from Australia and poverty level among boys under the age of 16 in the United States with a correlation coefficient (R) of 0.734 and weighted average of 13.9%, a difference of 20.3%.
Immigrants from Morocco vs Immigrants from Australia Child Poverty Among Boys Under 16

Child Poverty Among Boys Under 16 Correlation Summary

MeasurementImmigrants from MoroccoImmigrants from Australia
Minimum4.7%1.3%
Maximum66.7%100.0%
Range61.9%98.7%
Mean20.3%20.1%
Median16.5%15.6%
Interquartile 25% (IQ1)13.8%10.4%
Interquartile 75% (IQ3)24.0%20.1%
Interquartile Range (IQR)10.3%9.7%
Standard Deviation (Sample)13.9%17.6%
Standard Deviation (Population)13.7%17.4%

Similar Demographics by Child Poverty Among Boys Under 16

Demographics Similar to Immigrants from Morocco by Child Poverty Among Boys Under 16

In terms of child poverty among boys under 16, the demographic groups most similar to Immigrants from Morocco are Immigrants from Costa Rica (16.7%, a difference of 0.39%), Immigrants from South America (16.7%, a difference of 0.39%), Arab (16.8%, a difference of 0.42%), Hmong (16.6%, a difference of 0.47%), and Alaska Native (16.8%, a difference of 0.59%).
DemographicsRating | RankChild Poverty Among Boys Under 16
Lebanese
43.3
/100
|
#182
Average
16.6%
Kenyans
41.0
/100
|
#183
Average
16.6%
Celtics
40.6
/100
|
#184
Average
16.6%
Immigrants | Western Asia
40.4
/100
|
#185
Average
16.6%
Hmong
38.4
/100
|
#186
Fair
16.6%
Immigrants | Costa Rica
37.8
/100
|
#187
Fair
16.7%
Immigrants | South America
37.7
/100
|
#188
Fair
16.7%
Immigrants | Morocco
34.5
/100
|
#189
Fair
16.7%
Arabs
31.1
/100
|
#190
Fair
16.8%
Alaska Natives
29.8
/100
|
#191
Fair
16.8%
Immigrants | Uganda
21.6
/100
|
#192
Fair
17.0%
Immigrants | Iraq
21.6
/100
|
#193
Fair
17.0%
Immigrants | Lebanon
21.2
/100
|
#194
Fair
17.0%
Spanish
20.8
/100
|
#195
Fair
17.0%
Spaniards
20.5
/100
|
#196
Fair
17.1%

Demographics Similar to Immigrants from Australia by Child Poverty Among Boys Under 16

In terms of child poverty among boys under 16, the demographic groups most similar to Immigrants from Australia are Immigrants from Northern Europe (13.9%, a difference of 0.14%), Immigrants from Asia (13.9%, a difference of 0.24%), Immigrants from Sri Lanka (13.9%, a difference of 0.28%), Lithuanian (14.0%, a difference of 0.33%), and Korean (14.0%, a difference of 0.36%).
DemographicsRating | RankChild Poverty Among Boys Under 16
Immigrants | China
99.8
/100
|
#32
Exceptional
13.6%
Danes
99.8
/100
|
#33
Exceptional
13.6%
Assyrians/Chaldeans/Syriacs
99.8
/100
|
#34
Exceptional
13.6%
Russians
99.7
/100
|
#35
Exceptional
13.8%
Luxembourgers
99.7
/100
|
#36
Exceptional
13.8%
Immigrants | Sri Lanka
99.6
/100
|
#37
Exceptional
13.9%
Immigrants | Northern Europe
99.6
/100
|
#38
Exceptional
13.9%
Immigrants | Australia
99.6
/100
|
#39
Exceptional
13.9%
Immigrants | Asia
99.6
/100
|
#40
Exceptional
13.9%
Lithuanians
99.6
/100
|
#41
Exceptional
14.0%
Koreans
99.6
/100
|
#42
Exceptional
14.0%
Croatians
99.5
/100
|
#43
Exceptional
14.0%
Estonians
99.4
/100
|
#44
Exceptional
14.1%
Immigrants | Scotland
99.4
/100
|
#45
Exceptional
14.1%
Greeks
99.4
/100
|
#46
Exceptional
14.1%