Immigrants from Northern Europe vs Yuman Single Father Poverty

COMPARE

Immigrants from Northern Europe
Race
Ancestry
AfghanAfricanAlaska NativeAlaskan AthabascanAlbanianAleutAlsatianAmericanApacheArabArapahoArgentineanArmenianAssyrian/Chaldean/SyriacAustralianAustrianBahamianBangladeshiBarbadianBasqueBelgianBelizeanBermudanBhutaneseBlackfeetBolivianBrazilianBritishBritish West IndianBulgarianBurmeseCajunCambodianCanadianCape VerdeanCarpatho RusynCelticCentral AmericanCentral American IndianCherokeeCheyenneChickasawChileanChineseChippewaChoctawColombianColvilleComancheCosta RicanCreeCreekCroatianCrowCubanCypriotCzechCzechoslovakianDanishDelawareDominicanDutchDutch West IndianEastern EuropeanEcuadorianEgyptianEnglishEstonianEthiopianEuropeanFijianFilipinoFinnishFrenchFrench American IndianFrench CanadianGermanGerman RussianGhanaianGreekGuamanian/ChamorroGuatemalanGuyaneseHaitianHmongHonduranHopiHoumaHungarianIcelanderIndian (Asian)IndonesianInupiatIranianIraqiIrishIroquoisIsraeliItalianJamaicanJapaneseJordanianKenyanKiowaKoreanLaotianLatvianLebaneseLiberianLithuanianLumbeeLuxembourgerMacedonianMalaysianMalteseMarshalleseMenomineeMexicanMexican American IndianMongolianMoroccanNative HawaiianNavajoNepaleseNew ZealanderNicaraguanNigerianNorthern EuropeanNorwegianOkinawanOsageOttawaPaiutePakistaniPalestinianPanamanianParaguayanPennsylvania GermanPeruvianPimaPolishPortuguesePotawatomiPuebloPuerto RicanPuget Sound SalishRomanianRussianSalvadoranSamoanScandinavianScotch-IrishScottishSeminoleSenegaleseSerbianShoshoneSierra LeoneanSiouxSlavicSlovakSloveneSomaliSouth AfricanSouth AmericanSouth American IndianSoviet UnionSpaniardSpanishSpanish AmericanSpanish American IndianSri LankanSubsaharan AfricanSudaneseSwedishSwissSyrianTaiwaneseThaiTlingit-HaidaTohono O'OdhamTonganTrinidadian and TobagonianTsimshianTurkishU.S. Virgin IslanderUgandanUkrainianUruguayanUteVenezuelanVietnameseWelshWest IndianYakamaYaquiYugoslavianYup'ikZimbabwean
Immigration
NonimmigrantsImmigrantsAfghanistanAfricaAlbaniaArgentinaArmeniaAsiaAustraliaAustriaBahamasBangladeshBarbadosBelarusBelgiumBelizeBoliviaBosnia and HerzegovinaBrazilBulgariaBurma/MyanmarCabo VerdeCambodiaCameroonCanadaCaribbeanCentral AmericaChileChinaColombiaCongoCosta RicaCroatiaCubaCzechoslovakiaDenmarkDominicaDominican RepublicEastern AfricaEastern AsiaEastern EuropeEcuadorEgyptEl SalvadorEnglandEritreaEthiopiaEuropeFijiFranceGermanyGhanaGreeceGrenadaGuatemalaGuyanaHaitiHondurasHong KongHungaryIndiaIndonesiaIranIraqIrelandIsraelItalyJamaicaJapanJordanKazakhstanKenyaKoreaKuwaitLaosLatin AmericaLatviaLebanonLiberiaLithuaniaMalaysiaMexicoMicronesiaMiddle AfricaMoldovaMoroccoNepalNetherlandsNicaraguaNigeriaNorth AmericaNorth MacedoniaNorthern AfricaNorthern EuropeNorwayOceaniaPakistanPanamaPeruPhilippinesPolandPortugalRomaniaRussiaSaudi ArabiaScotlandSenegalSerbiaSierra LeoneSingaporeSomaliaSouth AfricaSouth AmericaSouth Central AsiaSouth Eastern AsiaSouthern EuropeSpainSri LankaSt. Vincent and the GrenadinesSudanSwedenSwitzerlandSyriaTaiwanThailandTrinidad and TobagoTurkeyUgandaUkraineUruguayUzbekistanVenezuelaVietnamWest IndiesWestern AfricaWestern AsiaWestern EuropeYemenZaireZimbabweAzores
Yuman
Race
Ancestry
AfghanAfricanAlaska NativeAlaskan AthabascanAlbanianAleutAlsatianAmericanApacheArabArapahoArgentineanArmenianAssyrian/Chaldean/SyriacAustralianAustrianBahamianBangladeshiBarbadianBasqueBelgianBelizeanBermudanBhutaneseBlackfeetBolivianBrazilianBritishBritish West IndianBulgarianBurmeseCajunCambodianCanadianCape VerdeanCarpatho RusynCelticCentral AmericanCentral American IndianCherokeeCheyenneChickasawChileanChineseChippewaChoctawColombianColvilleComancheCosta RicanCreeCreekCroatianCrowCubanCypriotCzechCzechoslovakianDanishDelawareDominicanDutchDutch West IndianEastern EuropeanEcuadorianEgyptianEnglishEstonianEthiopianEuropeanFijianFilipinoFinnishFrenchFrench American IndianFrench CanadianGermanGerman RussianGhanaianGreekGuamanian/ChamorroGuatemalanGuyaneseHaitianHmongHonduranHopiHoumaHungarianIcelanderIndian (Asian)IndonesianInupiatIranianIraqiIrishIroquoisIsraeliItalianJamaicanJapaneseJordanianKenyanKiowaKoreanLaotianLatvianLebaneseLiberianLithuanianLumbeeLuxembourgerMacedonianMalaysianMalteseMarshalleseMenomineeMexicanMexican American IndianMongolianMoroccanNative HawaiianNavajoNepaleseNew ZealanderNicaraguanNigerianNorthern EuropeanNorwegianOkinawanOsageOttawaPaiutePakistaniPalestinianPanamanianParaguayanPennsylvania GermanPeruvianPimaPolishPortuguesePotawatomiPuebloPuerto RicanPuget Sound SalishRomanianRussianSalvadoranSamoanScandinavianScotch-IrishScottishSeminoleSenegaleseSerbianShoshoneSierra LeoneanSiouxSlavicSlovakSloveneSomaliSouth AfricanSouth AmericanSouth American IndianSoviet UnionSpaniardSpanishSpanish AmericanSpanish American IndianSri LankanSubsaharan AfricanSudaneseSwedishSwissSyrianTaiwaneseThaiTlingit-HaidaTohono O'OdhamTonganTrinidadian and TobagonianTsimshianTurkishU.S. Virgin IslanderUgandanUkrainianUruguayanUteVenezuelanVietnameseWelshWest IndianYakamaYaquiYugoslavianYumanYup'ikZimbabwean
Immigration
NonimmigrantsImmigrantsAfghanistanAfricaAlbaniaArgentinaArmeniaAsiaAustraliaAustriaBahamasBangladeshBarbadosBelarusBelgiumBelizeBoliviaBosnia and HerzegovinaBrazilBulgariaBurma/MyanmarCabo VerdeCambodiaCameroonCanadaCaribbeanCentral AmericaChileChinaColombiaCongoCosta RicaCroatiaCubaCzechoslovakiaDenmarkDominicaDominican RepublicEastern AfricaEastern AsiaEastern EuropeEcuadorEgyptEl SalvadorEnglandEritreaEthiopiaEuropeFijiFranceGermanyGhanaGreeceGrenadaGuatemalaGuyanaHaitiHondurasHong KongHungaryIndiaIndonesiaIranIraqIrelandIsraelItalyJamaicaJapanJordanKazakhstanKenyaKoreaKuwaitLaosLatin AmericaLatviaLebanonLiberiaLithuaniaMalaysiaMexicoMicronesiaMiddle AfricaMoldovaMoroccoNepalNetherlandsNicaraguaNigeriaNorth AmericaNorth MacedoniaNorthern AfricaNorwayOceaniaPakistanPanamaPeruPhilippinesPolandPortugalRomaniaRussiaSaudi ArabiaScotlandSenegalSerbiaSierra LeoneSingaporeSomaliaSouth AfricaSouth AmericaSouth Central AsiaSouth Eastern AsiaSouthern EuropeSpainSri LankaSt. Vincent and the GrenadinesSudanSwedenSwitzerlandSyriaTaiwanThailandTrinidad and TobagoTurkeyUgandaUkraineUruguayUzbekistanVenezuelaVietnamWest IndiesWestern AfricaWestern AsiaWestern EuropeYemenZaireZimbabweAzores
Single Father Poverty
Income
Poverty
Unemployment
Labor Participation
Family Structure
Vehicle Availability
Education Level
Disability

Single Father Poverty Comparison

Immigrants from Northern Europe

Yuman

Fair
Tragic
16.5%
SINGLE FATHER POVERTY
20.3/ 100
METRIC RATING
197th/ 347
METRIC RANK
28.4%
SINGLE FATHER POVERTY
0.0/ 100
METRIC RATING
342nd/ 347
METRIC RANK

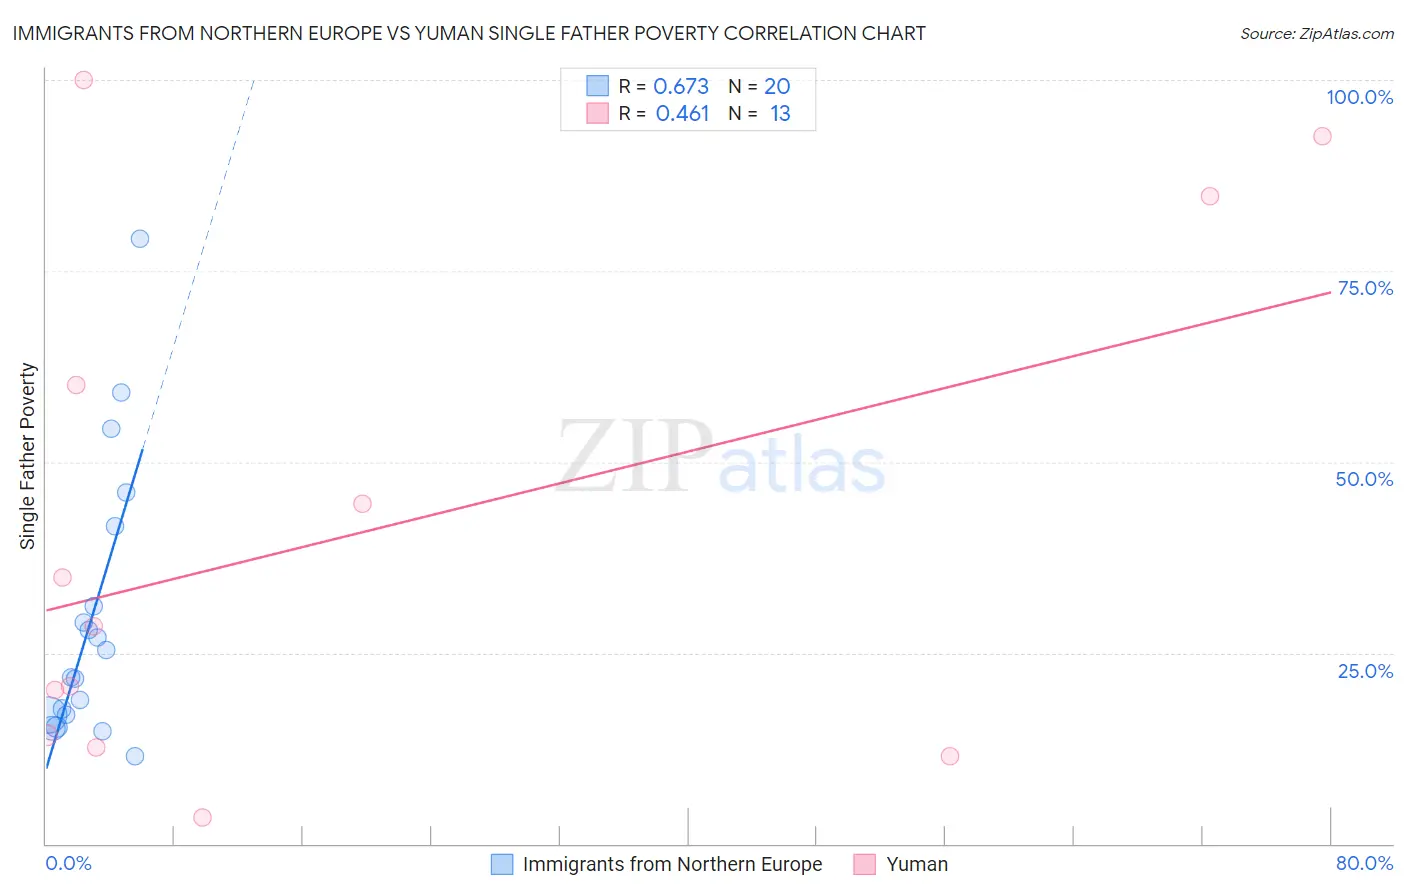
Immigrants from Northern Europe vs Yuman Single Father Poverty Correlation Chart

The statistical analysis conducted on geographies consisting of 359,106,095 people shows a significant positive correlation between the proportion of Immigrants from Northern Europe and poverty level among single fathers in the United States with a correlation coefficient (R) of 0.673 and weighted average of 16.5%. Similarly, the statistical analysis conducted on geographies consisting of 39,127,530 people shows a moderate positive correlation between the proportion of Yuman and poverty level among single fathers in the United States with a correlation coefficient (R) of 0.461 and weighted average of 28.4%, a difference of 71.6%.
Immigrants from Northern Europe vs Yuman Single Father Poverty

Single Father Poverty Correlation Summary

MeasurementImmigrants from Northern EuropeYuman
Minimum11.5%3.4%
Maximum79.2%100.0%
Range67.7%96.6%
Mean29.5%40.6%
Median23.6%28.5%
Interquartile 25% (IQ1)16.9%13.4%
Interquartile 75% (IQ3)36.3%72.4%
Interquartile Range (IQR)19.4%58.9%
Standard Deviation (Sample)17.8%33.3%
Standard Deviation (Population)17.4%32.0%

Similar Demographics by Single Father Poverty

Demographics Similar to Immigrants from Northern Europe by Single Father Poverty

In terms of single father poverty, the demographic groups most similar to Immigrants from Northern Europe are Romanian (16.5%, a difference of 0.010%), Immigrants from Belize (16.5%, a difference of 0.030%), Immigrants from Canada (16.5%, a difference of 0.11%), Syrian (16.6%, a difference of 0.20%), and Cape Verdean (16.5%, a difference of 0.26%).
DemographicsRating | RankSingle Father Poverty
Immigrants | Burma/Myanmar
28.0
/100
|
#190
Fair
16.5%
Immigrants | Guyana
27.1
/100
|
#191
Fair
16.5%
Immigrants | Switzerland
24.8
/100
|
#192
Fair
16.5%
Ecuadorians
24.5
/100
|
#193
Fair
16.5%
Cape Verdeans
24.4
/100
|
#194
Fair
16.5%
Immigrants | Barbados
24.3
/100
|
#195
Fair
16.5%
Immigrants | Canada
21.9
/100
|
#196
Fair
16.5%
Immigrants | Northern Europe
20.3
/100
|
#197
Fair
16.5%
Romanians
20.1
/100
|
#198
Fair
16.5%
Immigrants | Belize
19.8
/100
|
#199
Poor
16.5%
Syrians
17.4
/100
|
#200
Poor
16.6%
Cubans
16.5
/100
|
#201
Poor
16.6%
Immigrants | Croatia
16.5
/100
|
#202
Poor
16.6%
Immigrants | North America
15.1
/100
|
#203
Poor
16.6%
Immigrants | Guatemala
14.8
/100
|
#204
Poor
16.6%

Demographics Similar to Yuman by Single Father Poverty

In terms of single father poverty, the demographic groups most similar to Yuman are Lumbee (28.5%, a difference of 0.33%), Navajo (29.2%, a difference of 2.9%), Hopi (27.2%, a difference of 4.5%), Houma (26.7%, a difference of 6.2%), and Crow (30.3%, a difference of 6.7%).
DemographicsRating | RankSingle Father Poverty
Natives/Alaskans
0.0
/100
|
#333
Tragic
22.4%
Kiowa
0.0
/100
|
#334
Tragic
22.5%
Shoshone
0.0
/100
|
#335
Tragic
22.9%
Cajuns
0.0
/100
|
#336
Tragic
23.1%
Sioux
0.0
/100
|
#337
Tragic
23.9%
Arapaho
0.0
/100
|
#338
Tragic
24.0%
Apache
0.0
/100
|
#339
Tragic
24.2%
Houma
0.0
/100
|
#340
Tragic
26.7%
Hopi
0.0
/100
|
#341
Tragic
27.2%
Yuman
0.0
/100
|
#342
Tragic
28.4%
Lumbee
0.0
/100
|
#343
Tragic
28.5%
Navajo
0.0
/100
|
#344
Tragic
29.2%
Crow
0.0
/100
|
#345
Tragic
30.3%
Puerto Ricans
0.0
/100
|
#346
Tragic
31.5%
Yup'ik
0.0
/100
|
#347
Tragic
32.5%