Immigrants from Northern Europe vs Immigrants from Cuba Single Father Poverty
COMPARE
Immigrants from Northern Europe
Immigrants from Cuba
Single Father Poverty
Single Father Poverty Comparison
Immigrants from Northern Europe
Immigrants from Cuba
16.5%
SINGLE FATHER POVERTY
20.3/ 100
METRIC RATING
197th/ 347
METRIC RANK
16.4%
SINGLE FATHER POVERTY
41.6/ 100
METRIC RATING
178th/ 347
METRIC RANK
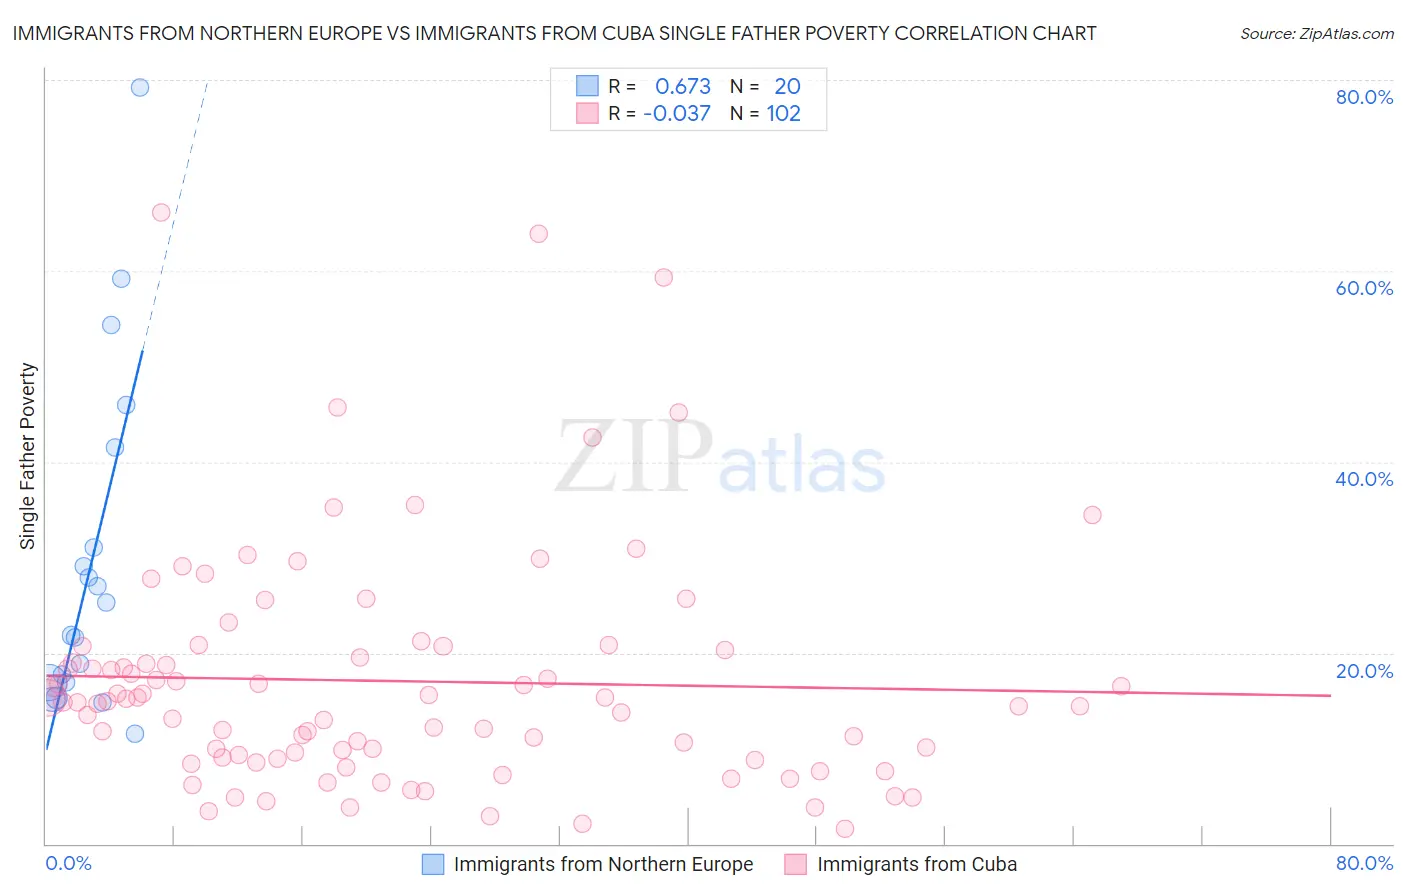
Immigrants from Northern Europe vs Immigrants from Cuba Single Father Poverty Correlation Chart
The statistical analysis conducted on geographies consisting of 359,106,095 people shows a significant positive correlation between the proportion of Immigrants from Northern Europe and poverty level among single fathers in the United States with a correlation coefficient (R) of 0.673 and weighted average of 16.5%. Similarly, the statistical analysis conducted on geographies consisting of 265,819,511 people shows no correlation between the proportion of Immigrants from Cuba and poverty level among single fathers in the United States with a correlation coefficient (R) of -0.037 and weighted average of 16.4%, a difference of 1.1%.
Single Father Poverty Correlation Summary
| Measurement | Immigrants from Northern Europe | Immigrants from Cuba |
| Minimum | 11.5% | 1.6% |
| Maximum | 79.2% | 66.1% |
| Range | 67.7% | 64.5% |
| Mean | 29.5% | 17.0% |
| Median | 23.6% | 14.9% |
| Interquartile 25% (IQ1) | 16.9% | 9.0% |
| Interquartile 75% (IQ3) | 36.3% | 20.3% |
| Interquartile Range (IQR) | 19.4% | 11.3% |
| Standard Deviation (Sample) | 17.8% | 12.2% |
| Standard Deviation (Population) | 17.4% | 12.2% |
Demographics Similar to Immigrants from Northern Europe and Immigrants from Cuba by Single Father Poverty
In terms of single father poverty, the demographic groups most similar to Immigrants from Northern Europe are Immigrants from Canada (16.5%, a difference of 0.11%), Cape Verdean (16.5%, a difference of 0.26%), Immigrants from Barbados (16.5%, a difference of 0.26%), Ecuadorian (16.5%, a difference of 0.27%), and Immigrants from Switzerland (16.5%, a difference of 0.28%). Similarly, the demographic groups most similar to Immigrants from Cuba are Serbian (16.4%, a difference of 0.030%), Immigrants from South Africa (16.3%, a difference of 0.12%), Immigrants from Latin America (16.4%, a difference of 0.20%), Immigrants from Western Africa (16.4%, a difference of 0.26%), and Immigrants from Italy (16.4%, a difference of 0.27%).
| Demographics | Rating | Rank | Single Father Poverty |
| Immigrants | South Africa | 44.2 /100 | #177 | Average 16.3% |
| Immigrants | Cuba | 41.6 /100 | #178 | Average 16.4% |
| Serbians | 40.9 /100 | #179 | Average 16.4% |
| Immigrants | Latin America | 37.2 /100 | #180 | Fair 16.4% |
| Immigrants | Western Africa | 36.0 /100 | #181 | Fair 16.4% |
| Immigrants | Italy | 35.7 /100 | #182 | Fair 16.4% |
| Aleuts | 35.3 /100 | #183 | Fair 16.4% |
| Cambodians | 34.6 /100 | #184 | Fair 16.4% |
| Panamanians | 33.6 /100 | #185 | Fair 16.4% |
| Immigrants | Venezuela | 31.0 /100 | #186 | Fair 16.4% |
| Ukrainians | 30.4 /100 | #187 | Fair 16.4% |
| Russians | 30.1 /100 | #188 | Fair 16.4% |
| Latvians | 28.9 /100 | #189 | Fair 16.5% |
| Immigrants | Burma/Myanmar | 28.0 /100 | #190 | Fair 16.5% |
| Immigrants | Guyana | 27.1 /100 | #191 | Fair 16.5% |
| Immigrants | Switzerland | 24.8 /100 | #192 | Fair 16.5% |
| Ecuadorians | 24.5 /100 | #193 | Fair 16.5% |
| Cape Verdeans | 24.4 /100 | #194 | Fair 16.5% |
| Immigrants | Barbados | 24.3 /100 | #195 | Fair 16.5% |
| Immigrants | Canada | 21.9 /100 | #196 | Fair 16.5% |
| Immigrants | Northern Europe | 20.3 /100 | #197 | Fair 16.5% |