Immigrants from Nicaragua vs Immigrants from Northern Africa Receiving Food Stamps
COMPARE
Immigrants from Nicaragua
Immigrants from Northern Africa
Receiving Food Stamps
Receiving Food Stamps Comparison
Immigrants from Nicaragua
Immigrants from Northern Africa
17.2%
RECEIVING FOOD STAMPS
0.0/ 100
METRIC RATING
320th/ 347
METRIC RANK
11.0%
RECEIVING FOOD STAMPS
86.0/ 100
METRIC RATING
143rd/ 347
METRIC RANK
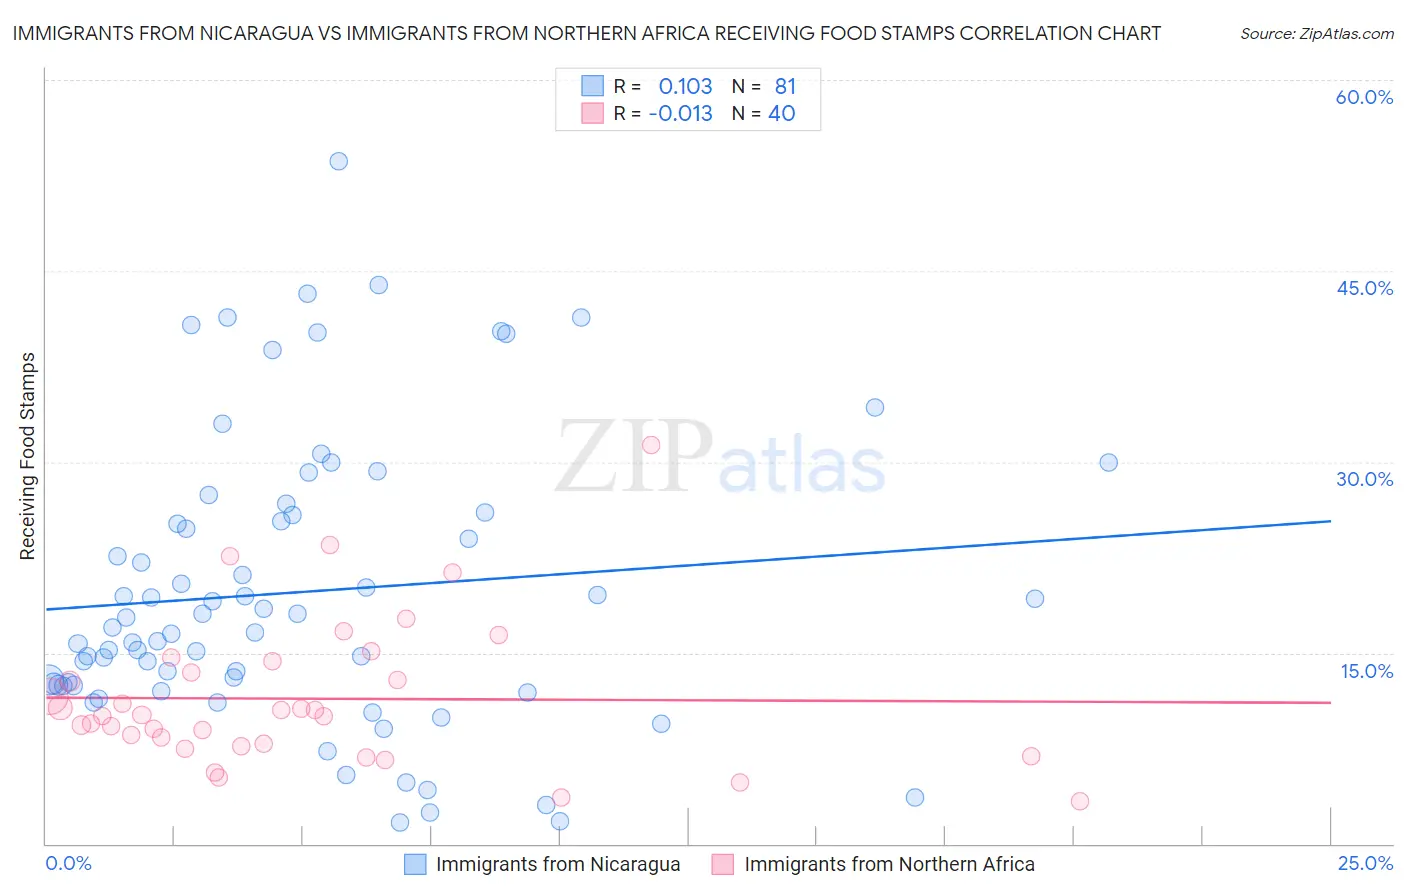
Immigrants from Nicaragua vs Immigrants from Northern Africa Receiving Food Stamps Correlation Chart
The statistical analysis conducted on geographies consisting of 236,159,381 people shows a poor positive correlation between the proportion of Immigrants from Nicaragua and percentage of population receiving government assistance and/or food stamps in the United States with a correlation coefficient (R) of 0.103 and weighted average of 17.2%. Similarly, the statistical analysis conducted on geographies consisting of 320,586,734 people shows no correlation between the proportion of Immigrants from Northern Africa and percentage of population receiving government assistance and/or food stamps in the United States with a correlation coefficient (R) of -0.013 and weighted average of 11.0%, a difference of 56.9%.
Receiving Food Stamps Correlation Summary
| Measurement | Immigrants from Nicaragua | Immigrants from Northern Africa |
| Minimum | 1.7% | 3.3% |
| Maximum | 53.6% | 31.3% |
| Range | 51.9% | 28.0% |
| Mean | 19.8% | 11.4% |
| Median | 17.0% | 10.1% |
| Interquartile 25% (IQ1) | 12.4% | 7.8% |
| Interquartile 75% (IQ3) | 25.9% | 13.9% |
| Interquartile Range (IQR) | 13.5% | 6.1% |
| Standard Deviation (Sample) | 11.3% | 5.8% |
| Standard Deviation (Population) | 11.2% | 5.7% |
Similar Demographics by Receiving Food Stamps
Demographics Similar to Immigrants from Nicaragua by Receiving Food Stamps
In terms of receiving food stamps, the demographic groups most similar to Immigrants from Nicaragua are Immigrants from St. Vincent and the Grenadines (17.2%, a difference of 0.080%), Native/Alaskan (17.3%, a difference of 0.18%), Menominee (17.2%, a difference of 0.26%), Black/African American (17.2%, a difference of 0.43%), and Central American Indian (17.1%, a difference of 0.96%).
| Demographics | Rating | Rank | Receiving Food Stamps |
| Immigrants | Jamaica | 0.0 /100 | #313 | Tragic 16.9% |
| Immigrants | Guyana | 0.0 /100 | #314 | Tragic 16.9% |
| Bahamians | 0.0 /100 | #315 | Tragic 17.0% |
| Central American Indians | 0.0 /100 | #316 | Tragic 17.1% |
| Blacks/African Americans | 0.0 /100 | #317 | Tragic 17.2% |
| Menominee | 0.0 /100 | #318 | Tragic 17.2% |
| Immigrants | St. Vincent and the Grenadines | 0.0 /100 | #319 | Tragic 17.2% |
| Immigrants | Nicaragua | 0.0 /100 | #320 | Tragic 17.2% |
| Natives/Alaskans | 0.0 /100 | #321 | Tragic 17.3% |
| Immigrants | Grenada | 0.0 /100 | #322 | Tragic 17.8% |
| Haitians | 0.0 /100 | #323 | Tragic 17.8% |
| British West Indians | 0.0 /100 | #324 | Tragic 17.9% |
| Immigrants | Haiti | 0.0 /100 | #325 | Tragic 18.2% |
| Cubans | 0.0 /100 | #326 | Tragic 18.2% |
| Apache | 0.0 /100 | #327 | Tragic 18.3% |
Demographics Similar to Immigrants from Northern Africa by Receiving Food Stamps
In terms of receiving food stamps, the demographic groups most similar to Immigrants from Northern Africa are Chilean (11.0%, a difference of 0.080%), Syrian (11.0%, a difference of 0.15%), Immigrants from Vietnam (11.0%, a difference of 0.25%), Hungarian (11.0%, a difference of 0.27%), and Taiwanese (11.0%, a difference of 0.51%).
| Demographics | Rating | Rank | Receiving Food Stamps |
| Slovaks | 89.8 /100 | #136 | Excellent 10.8% |
| Immigrants | Eastern Europe | 89.8 /100 | #137 | Excellent 10.8% |
| Immigrants | Moldova | 88.5 /100 | #138 | Excellent 10.9% |
| Hmong | 88.4 /100 | #139 | Excellent 10.9% |
| Celtics | 87.8 /100 | #140 | Excellent 10.9% |
| Immigrants | Vietnam | 86.7 /100 | #141 | Excellent 11.0% |
| Chileans | 86.2 /100 | #142 | Excellent 11.0% |
| Immigrants | Northern Africa | 86.0 /100 | #143 | Excellent 11.0% |
| Syrians | 85.5 /100 | #144 | Excellent 11.0% |
| Hungarians | 85.1 /100 | #145 | Excellent 11.0% |
| Taiwanese | 84.2 /100 | #146 | Excellent 11.0% |
| Whites/Caucasians | 83.9 /100 | #147 | Excellent 11.1% |
| Immigrants | South Eastern Asia | 83.3 /100 | #148 | Excellent 11.1% |
| Brazilians | 83.2 /100 | #149 | Excellent 11.1% |
| Soviet Union | 83.1 /100 | #150 | Excellent 11.1% |