Immigrants from Netherlands vs Ethiopian Receiving Food Stamps

COMPARE

Immigrants from Netherlands
Race
Ancestry
AfghanAfricanAlaska NativeAlaskan AthabascanAlbanianAleutAlsatianAmericanApacheArabArapahoArgentineanArmenianAssyrian/Chaldean/SyriacAustralianAustrianBahamianBangladeshiBarbadianBasqueBelgianBelizeanBermudanBhutaneseBlackfeetBolivianBrazilianBritishBritish West IndianBulgarianBurmeseCajunCambodianCanadianCape VerdeanCarpatho RusynCelticCentral AmericanCentral American IndianCherokeeCheyenneChickasawChileanChineseChippewaChoctawColombianColvilleComancheCosta RicanCreeCreekCroatianCrowCubanCypriotCzechCzechoslovakianDanishDelawareDominicanDutchDutch West IndianEastern EuropeanEcuadorianEgyptianEnglishEstonianEuropeanFijianFilipinoFinnishFrenchFrench American IndianFrench CanadianGermanGerman RussianGhanaianGreekGuamanian/ChamorroGuatemalanGuyaneseHaitianHmongHonduranHopiHoumaHungarianIcelanderIndian (Asian)IndonesianInupiatIranianIraqiIrishIroquoisIsraeliItalianJamaicanJapaneseJordanianKenyanKiowaKoreanLaotianLatvianLebaneseLiberianLithuanianLumbeeLuxembourgerMacedonianMalaysianMalteseMarshalleseMenomineeMexicanMexican American IndianMongolianMoroccanNative HawaiianNavajoNepaleseNew ZealanderNicaraguanNigerianNorthern EuropeanNorwegianOkinawanOsageOttawaPaiutePakistaniPalestinianPanamanianParaguayanPennsylvania GermanPeruvianPimaPolishPortuguesePotawatomiPuebloPuerto RicanPuget Sound SalishRomanianRussianSalvadoranSamoanScandinavianScotch-IrishScottishSeminoleSenegaleseSerbianShoshoneSierra LeoneanSiouxSlavicSlovakSloveneSomaliSouth AfricanSouth AmericanSouth American IndianSoviet UnionSpaniardSpanishSpanish AmericanSpanish American IndianSri LankanSubsaharan AfricanSudaneseSwedishSwissSyrianTaiwaneseThaiTlingit-HaidaTohono O'OdhamTonganTrinidadian and TobagonianTsimshianTurkishU.S. Virgin IslanderUgandanUkrainianUruguayanUteVenezuelanVietnameseWelshWest IndianYakamaYaquiYugoslavianYumanYup'ikZimbabwean
Immigration
NonimmigrantsImmigrantsAfghanistanAfricaAlbaniaArgentinaArmeniaAsiaAustraliaAustriaBahamasBangladeshBarbadosBelarusBelgiumBelizeBoliviaBosnia and HerzegovinaBrazilBulgariaBurma/MyanmarCabo VerdeCambodiaCameroonCanadaCaribbeanCentral AmericaChileChinaColombiaCongoCosta RicaCroatiaCubaCzechoslovakiaDenmarkDominicaDominican RepublicEastern AfricaEastern AsiaEastern EuropeEcuadorEgyptEl SalvadorEnglandEritreaEthiopiaEuropeFijiFranceGermanyGhanaGreeceGrenadaGuatemalaGuyanaHaitiHondurasHong KongHungaryIndiaIndonesiaIranIraqIrelandIsraelItalyJamaicaJapanJordanKazakhstanKenyaKoreaKuwaitLaosLatin AmericaLatviaLebanonLiberiaLithuaniaMalaysiaMexicoMicronesiaMiddle AfricaMoldovaMoroccoNepalNetherlandsNicaraguaNigeriaNorth AmericaNorth MacedoniaNorthern AfricaNorthern EuropeNorwayOceaniaPakistanPanamaPeruPhilippinesPolandPortugalRomaniaRussiaSaudi ArabiaScotlandSenegalSerbiaSierra LeoneSingaporeSomaliaSouth AfricaSouth AmericaSouth Central AsiaSouth Eastern AsiaSouthern EuropeSpainSri LankaSt. Vincent and the GrenadinesSudanSwedenSwitzerlandSyriaTaiwanThailandTrinidad and TobagoTurkeyUgandaUkraineUruguayUzbekistanVenezuelaVietnamWest IndiesWestern AfricaWestern AsiaWestern EuropeYemenZaireZimbabweAzores
Ethiopian
Race
Ancestry
AfghanAfricanAlaska NativeAlaskan AthabascanAlbanianAleutAlsatianAmericanApacheArabArapahoArgentineanArmenianAssyrian/Chaldean/SyriacAustralianAustrianBahamianBangladeshiBarbadianBasqueBelgianBelizeanBermudanBhutaneseBlackfeetBolivianBrazilianBritishBritish West IndianBulgarianBurmeseCajunCambodianCanadianCape VerdeanCarpatho RusynCelticCentral AmericanCentral American IndianCherokeeCheyenneChickasawChileanChineseChippewaChoctawColombianColvilleComancheCosta RicanCreeCreekCroatianCrowCubanCypriotCzechCzechoslovakianDanishDelawareDominicanDutchDutch West IndianEastern EuropeanEcuadorianEgyptianEnglishEstonianEthiopianEuropeanFijianFilipinoFinnishFrenchFrench American IndianFrench CanadianGermanGerman RussianGhanaianGreekGuamanian/ChamorroGuatemalanGuyaneseHaitianHmongHonduranHopiHoumaHungarianIcelanderIndian (Asian)IndonesianInupiatIranianIraqiIrishIroquoisIsraeliItalianJamaicanJapaneseJordanianKenyanKiowaKoreanLaotianLatvianLebaneseLiberianLithuanianLumbeeLuxembourgerMacedonianMalaysianMalteseMarshalleseMenomineeMexicanMexican American IndianMongolianMoroccanNative HawaiianNavajoNepaleseNew ZealanderNicaraguanNigerianNorthern EuropeanNorwegianOkinawanOsageOttawaPaiutePakistaniPalestinianPanamanianParaguayanPennsylvania GermanPeruvianPimaPolishPortuguesePotawatomiPuebloPuerto RicanPuget Sound SalishRomanianRussianSalvadoranSamoanScandinavianScotch-IrishScottishSeminoleSenegaleseSerbianShoshoneSierra LeoneanSiouxSlavicSlovakSloveneSomaliSouth AfricanSouth AmericanSouth American IndianSoviet UnionSpaniardSpanishSpanish AmericanSpanish American IndianSri LankanSubsaharan AfricanSudaneseSwedishSwissSyrianTaiwaneseThaiTlingit-HaidaTohono O'OdhamTonganTrinidadian and TobagonianTsimshianTurkishU.S. Virgin IslanderUgandanUkrainianUruguayanUteVenezuelanVietnameseWelshWest IndianYakamaYaquiYugoslavianYumanYup'ikZimbabwean
Immigration
NonimmigrantsImmigrantsAfghanistanAfricaAlbaniaArgentinaArmeniaAsiaAustraliaAustriaBahamasBangladeshBarbadosBelarusBelgiumBelizeBoliviaBosnia and HerzegovinaBrazilBulgariaBurma/MyanmarCabo VerdeCambodiaCameroonCanadaCaribbeanCentral AmericaChileChinaColombiaCongoCosta RicaCroatiaCubaCzechoslovakiaDenmarkDominicaDominican RepublicEastern AfricaEastern AsiaEastern EuropeEcuadorEgyptEl SalvadorEnglandEritreaEthiopiaEuropeFijiFranceGermanyGhanaGreeceGrenadaGuatemalaGuyanaHaitiHondurasHong KongHungaryIndiaIndonesiaIranIraqIrelandIsraelItalyJamaicaJapanJordanKazakhstanKenyaKoreaKuwaitLaosLatin AmericaLatviaLebanonLiberiaLithuaniaMalaysiaMexicoMicronesiaMiddle AfricaMoldovaMoroccoNepalNicaraguaNigeriaNorth AmericaNorth MacedoniaNorthern AfricaNorthern EuropeNorwayOceaniaPakistanPanamaPeruPhilippinesPolandPortugalRomaniaRussiaSaudi ArabiaScotlandSenegalSerbiaSierra LeoneSingaporeSomaliaSouth AfricaSouth AmericaSouth Central AsiaSouth Eastern AsiaSouthern EuropeSpainSri LankaSt. Vincent and the GrenadinesSudanSwedenSwitzerlandSyriaTaiwanThailandTrinidad and TobagoTurkeyUgandaUkraineUruguayUzbekistanVenezuelaVietnamWest IndiesWestern AfricaWestern AsiaWestern EuropeYemenZaireZimbabweAzores
Receiving Food Stamps
Income
Poverty
Unemployment
Labor Participation
Family Structure
Vehicle Availability
Education Level
Disability

Receiving Food Stamps Comparison

Immigrants from Netherlands

Ethiopians

Exceptional
Exceptional
9.5%
RECEIVING FOOD STAMPS
99.5/ 100
METRIC RATING
40th/ 347
METRIC RANK
10.6%
RECEIVING FOOD STAMPS
93.9/ 100
METRIC RATING
120th/ 347
METRIC RANK

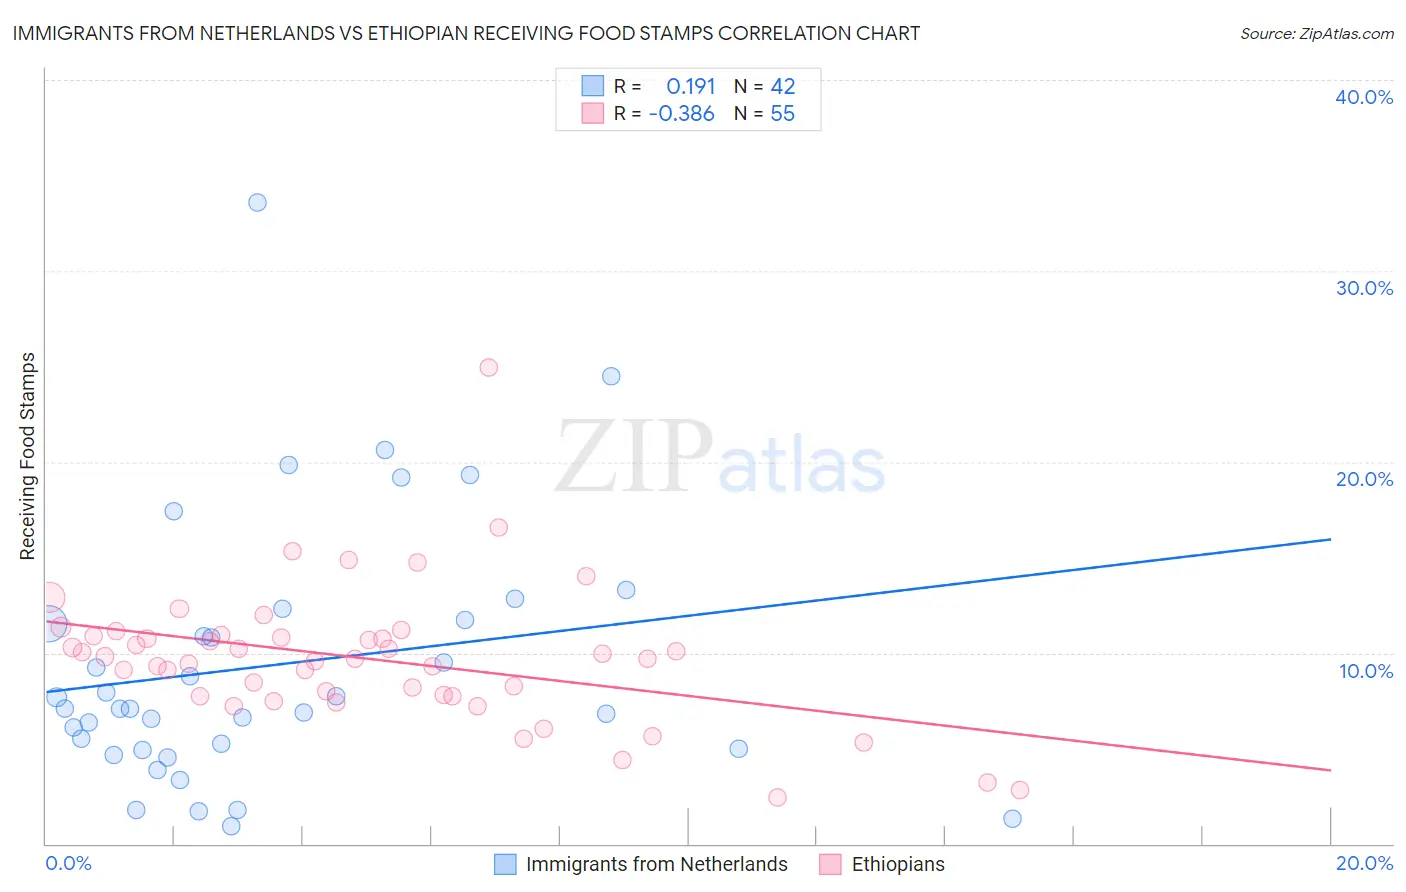
Immigrants from Netherlands vs Ethiopian Receiving Food Stamps Correlation Chart

The statistical analysis conducted on geographies consisting of 237,448,822 people shows a poor positive correlation between the proportion of Immigrants from Netherlands and percentage of population receiving government assistance and/or food stamps in the United States with a correlation coefficient (R) of 0.191 and weighted average of 9.5%. Similarly, the statistical analysis conducted on geographies consisting of 222,869,008 people shows a mild negative correlation between the proportion of Ethiopians and percentage of population receiving government assistance and/or food stamps in the United States with a correlation coefficient (R) of -0.386 and weighted average of 10.6%, a difference of 11.5%.
Immigrants from Netherlands vs Ethiopian Receiving Food Stamps

Receiving Food Stamps Correlation Summary

MeasurementImmigrants from NetherlandsEthiopian
Minimum0.90%2.4%
Maximum33.6%24.9%
Range32.7%22.5%
Mean9.4%9.7%
Median7.1%9.7%
Interquartile 25% (IQ1)5.0%7.8%
Interquartile 75% (IQ3)11.7%10.9%
Interquartile Range (IQR)6.7%3.1%
Standard Deviation (Sample)6.9%3.6%
Standard Deviation (Population)6.8%3.6%

Similar Demographics by Receiving Food Stamps

Demographics Similar to Immigrants from Netherlands by Receiving Food Stamps

In terms of receiving food stamps, the demographic groups most similar to Immigrants from Netherlands are Immigrants from Bolivia (9.5%, a difference of 0.010%), Immigrants from Sri Lanka (9.5%, a difference of 0.020%), Cambodian (9.5%, a difference of 0.17%), European (9.5%, a difference of 0.31%), and Estonian (9.5%, a difference of 0.37%).
DemographicsRating | RankReceiving Food Stamps
Zimbabweans
99.6
/100
|
#33
Exceptional
9.5%
Turks
99.6
/100
|
#34
Exceptional
9.5%
Immigrants | Austria
99.6
/100
|
#35
Exceptional
9.5%
Estonians
99.6
/100
|
#36
Exceptional
9.5%
Europeans
99.6
/100
|
#37
Exceptional
9.5%
Immigrants | Sri Lanka
99.5
/100
|
#38
Exceptional
9.5%
Immigrants | Bolivia
99.5
/100
|
#39
Exceptional
9.5%
Immigrants | Netherlands
99.5
/100
|
#40
Exceptional
9.5%
Cambodians
99.5
/100
|
#41
Exceptional
9.5%
Immigrants | China
99.5
/100
|
#42
Exceptional
9.6%
Croatians
99.5
/100
|
#43
Exceptional
9.6%
Immigrants | Denmark
99.4
/100
|
#44
Exceptional
9.6%
Immigrants | Belgium
99.4
/100
|
#45
Exceptional
9.6%
Australians
99.4
/100
|
#46
Exceptional
9.6%
Indians (Asian)
99.4
/100
|
#47
Exceptional
9.6%

Demographics Similar to Ethiopians by Receiving Food Stamps

In terms of receiving food stamps, the demographic groups most similar to Ethiopians are Immigrants from Poland (10.6%, a difference of 0.0%), Slavic (10.6%, a difference of 0.030%), Sri Lankan (10.6%, a difference of 0.11%), Assyrian/Chaldean/Syriac (10.6%, a difference of 0.17%), and Immigrants from Philippines (10.7%, a difference of 0.36%).
DemographicsRating | RankReceiving Food Stamps
Icelanders
95.4
/100
|
#113
Exceptional
10.5%
Scotch-Irish
95.1
/100
|
#114
Exceptional
10.5%
Immigrants | Saudi Arabia
94.9
/100
|
#115
Exceptional
10.5%
Canadians
94.8
/100
|
#116
Exceptional
10.5%
Immigrants | Nepal
94.6
/100
|
#117
Exceptional
10.6%
Assyrians/Chaldeans/Syriacs
94.1
/100
|
#118
Exceptional
10.6%
Immigrants | Poland
93.9
/100
|
#119
Exceptional
10.6%
Ethiopians
93.9
/100
|
#120
Exceptional
10.6%
Slavs
93.8
/100
|
#121
Exceptional
10.6%
Sri Lankans
93.7
/100
|
#122
Exceptional
10.6%
Immigrants | Philippines
93.3
/100
|
#123
Exceptional
10.7%
Paraguayans
93.0
/100
|
#124
Exceptional
10.7%
Ukrainians
92.8
/100
|
#125
Exceptional
10.7%
Afghans
92.6
/100
|
#126
Exceptional
10.7%
Immigrants | Ethiopia
92.6
/100
|
#127
Exceptional
10.7%