Immigrants from Nepal vs Immigrants from Middle Africa Child Poverty Among Girls Under 16

COMPARE

Immigrants from Nepal
Race
Ancestry
AfghanAfricanAlaska NativeAlaskan AthabascanAlbanianAleutAlsatianAmericanApacheArabArapahoArgentineanArmenianAssyrian/Chaldean/SyriacAustralianAustrianBahamianBangladeshiBarbadianBasqueBelgianBelizeanBermudanBhutaneseBlackfeetBolivianBrazilianBritishBritish West IndianBulgarianBurmeseCajunCambodianCanadianCape VerdeanCarpatho RusynCelticCentral AmericanCentral American IndianCherokeeCheyenneChickasawChileanChineseChippewaChoctawColombianColvilleComancheCosta RicanCreeCreekCroatianCrowCubanCypriotCzechCzechoslovakianDanishDelawareDominicanDutchDutch West IndianEastern EuropeanEcuadorianEgyptianEnglishEstonianEthiopianEuropeanFijianFilipinoFinnishFrenchFrench American IndianFrench CanadianGermanGerman RussianGhanaianGreekGuamanian/ChamorroGuatemalanGuyaneseHaitianHmongHonduranHopiHoumaHungarianIcelanderIndian (Asian)IndonesianInupiatIranianIraqiIrishIroquoisIsraeliItalianJamaicanJapaneseJordanianKenyanKiowaKoreanLaotianLatvianLebaneseLiberianLithuanianLumbeeLuxembourgerMacedonianMalaysianMalteseMarshalleseMenomineeMexicanMexican American IndianMongolianMoroccanNative HawaiianNavajoNepaleseNew ZealanderNicaraguanNigerianNorthern EuropeanNorwegianOkinawanOsageOttawaPaiutePakistaniPalestinianPanamanianParaguayanPennsylvania GermanPeruvianPimaPolishPortuguesePotawatomiPuebloPuerto RicanPuget Sound SalishRomanianRussianSalvadoranSamoanScandinavianScotch-IrishScottishSeminoleSenegaleseSerbianShoshoneSierra LeoneanSiouxSlavicSlovakSloveneSomaliSouth AfricanSouth AmericanSouth American IndianSoviet UnionSpaniardSpanishSpanish AmericanSpanish American IndianSri LankanSubsaharan AfricanSudaneseSwedishSwissSyrianTaiwaneseThaiTlingit-HaidaTohono O'OdhamTonganTrinidadian and TobagonianTsimshianTurkishU.S. Virgin IslanderUgandanUkrainianUruguayanUteVenezuelanVietnameseWelshWest IndianYakamaYaquiYugoslavianYumanYup'ikZimbabwean
Immigration
NonimmigrantsImmigrantsAfghanistanAfricaAlbaniaArgentinaArmeniaAsiaAustraliaAustriaBahamasBangladeshBarbadosBelarusBelgiumBelizeBoliviaBosnia and HerzegovinaBrazilBulgariaBurma/MyanmarCabo VerdeCambodiaCameroonCanadaCaribbeanCentral AmericaChileChinaColombiaCongoCosta RicaCroatiaCubaCzechoslovakiaDenmarkDominicaDominican RepublicEastern AfricaEastern AsiaEastern EuropeEcuadorEgyptEl SalvadorEnglandEritreaEthiopiaEuropeFijiFranceGermanyGhanaGreeceGrenadaGuatemalaGuyanaHaitiHondurasHong KongHungaryIndiaIndonesiaIranIraqIrelandIsraelItalyJamaicaJapanJordanKazakhstanKenyaKoreaKuwaitLaosLatin AmericaLatviaLebanonLiberiaLithuaniaMalaysiaMexicoMicronesiaMoldovaMoroccoNepalNetherlandsNicaraguaNigeriaNorth AmericaNorth MacedoniaNorthern AfricaNorthern EuropeNorwayOceaniaPakistanPanamaPeruPhilippinesPolandPortugalRomaniaRussiaSaudi ArabiaScotlandSenegalSerbiaSierra LeoneSingaporeSomaliaSouth AfricaSouth AmericaSouth Central AsiaSouth Eastern AsiaSouthern EuropeSpainSri LankaSt. Vincent and the GrenadinesSudanSwedenSwitzerlandSyriaTaiwanThailandTrinidad and TobagoTurkeyUgandaUkraineUruguayUzbekistanVenezuelaVietnamWest IndiesWestern AfricaWestern AsiaWestern EuropeYemenZaireZimbabweAzores
Immigrants from Middle Africa
Race
Ancestry
AfghanAfricanAlaska NativeAlaskan AthabascanAlbanianAleutAlsatianAmericanApacheArabArapahoArgentineanArmenianAssyrian/Chaldean/SyriacAustralianAustrianBahamianBangladeshiBarbadianBasqueBelgianBelizeanBermudanBhutaneseBlackfeetBolivianBrazilianBritishBritish West IndianBulgarianBurmeseCajunCambodianCanadianCape VerdeanCarpatho RusynCelticCentral AmericanCentral American IndianCherokeeCheyenneChickasawChileanChineseChippewaChoctawColombianColvilleComancheCosta RicanCreeCreekCroatianCrowCubanCypriotCzechCzechoslovakianDanishDelawareDominicanDutchDutch West IndianEastern EuropeanEcuadorianEgyptianEnglishEstonianEthiopianEuropeanFijianFilipinoFinnishFrenchFrench American IndianFrench CanadianGermanGerman RussianGhanaianGreekGuamanian/ChamorroGuatemalanGuyaneseHaitianHmongHonduranHopiHoumaHungarianIcelanderIndian (Asian)IndonesianInupiatIranianIraqiIrishIroquoisIsraeliItalianJamaicanJapaneseJordanianKenyanKiowaKoreanLaotianLatvianLebaneseLiberianLithuanianLumbeeLuxembourgerMacedonianMalaysianMalteseMarshalleseMenomineeMexicanMexican American IndianMongolianMoroccanNative HawaiianNavajoNepaleseNew ZealanderNicaraguanNigerianNorthern EuropeanNorwegianOkinawanOsageOttawaPaiutePakistaniPalestinianPanamanianParaguayanPennsylvania GermanPeruvianPimaPolishPortuguesePotawatomiPuebloPuerto RicanPuget Sound SalishRomanianRussianSalvadoranSamoanScandinavianScotch-IrishScottishSeminoleSenegaleseSerbianShoshoneSierra LeoneanSiouxSlavicSlovakSloveneSomaliSouth AfricanSouth AmericanSouth American IndianSoviet UnionSpaniardSpanishSpanish AmericanSpanish American IndianSri LankanSubsaharan AfricanSudaneseSwedishSwissSyrianTaiwaneseThaiTlingit-HaidaTohono O'OdhamTonganTrinidadian and TobagonianTsimshianTurkishU.S. Virgin IslanderUgandanUkrainianUruguayanUteVenezuelanVietnameseWelshWest IndianYakamaYaquiYugoslavianYumanYup'ikZimbabwean
Immigration
NonimmigrantsImmigrantsAfghanistanAfricaAlbaniaArgentinaArmeniaAsiaAustraliaAustriaBahamasBangladeshBarbadosBelarusBelgiumBelizeBoliviaBosnia and HerzegovinaBrazilBulgariaBurma/MyanmarCabo VerdeCambodiaCameroonCanadaCaribbeanCentral AmericaChileChinaColombiaCongoCosta RicaCroatiaCubaCzechoslovakiaDenmarkDominicaDominican RepublicEastern AfricaEastern AsiaEastern EuropeEcuadorEgyptEl SalvadorEnglandEritreaEthiopiaEuropeFijiFranceGermanyGhanaGreeceGrenadaGuatemalaGuyanaHaitiHondurasHong KongHungaryIndiaIndonesiaIranIraqIrelandIsraelItalyJamaicaJapanJordanKazakhstanKenyaKoreaKuwaitLaosLatin AmericaLatviaLebanonLiberiaLithuaniaMalaysiaMexicoMicronesiaMiddle AfricaMoldovaMoroccoNetherlandsNicaraguaNigeriaNorth AmericaNorth MacedoniaNorthern AfricaNorthern EuropeNorwayOceaniaPakistanPanamaPeruPhilippinesPolandPortugalRomaniaRussiaSaudi ArabiaScotlandSenegalSerbiaSierra LeoneSingaporeSomaliaSouth AfricaSouth AmericaSouth Central AsiaSouth Eastern AsiaSouthern EuropeSpainSri LankaSt. Vincent and the GrenadinesSudanSwedenSwitzerlandSyriaTaiwanThailandTrinidad and TobagoTurkeyUgandaUkraineUruguayUzbekistanVenezuelaVietnamWest IndiesWestern AfricaWestern AsiaWestern EuropeYemenZaireZimbabweAzores
Child Poverty Among Girls Under 16
Income
Poverty
Unemployment
Labor Participation
Family Structure
Vehicle Availability
Education Level
Disability

Child Poverty Among Girls Under 16 Comparison

Immigrants from Nepal

Immigrants from Middle Africa

Good
Tragic
15.9%
CHILD POVERTY AMONG GIRLS UNDER 16
78.5/ 100
METRIC RATING
153rd/ 347
METRIC RANK
19.2%
CHILD POVERTY AMONG GIRLS UNDER 16
0.3/ 100
METRIC RATING
252nd/ 347
METRIC RANK

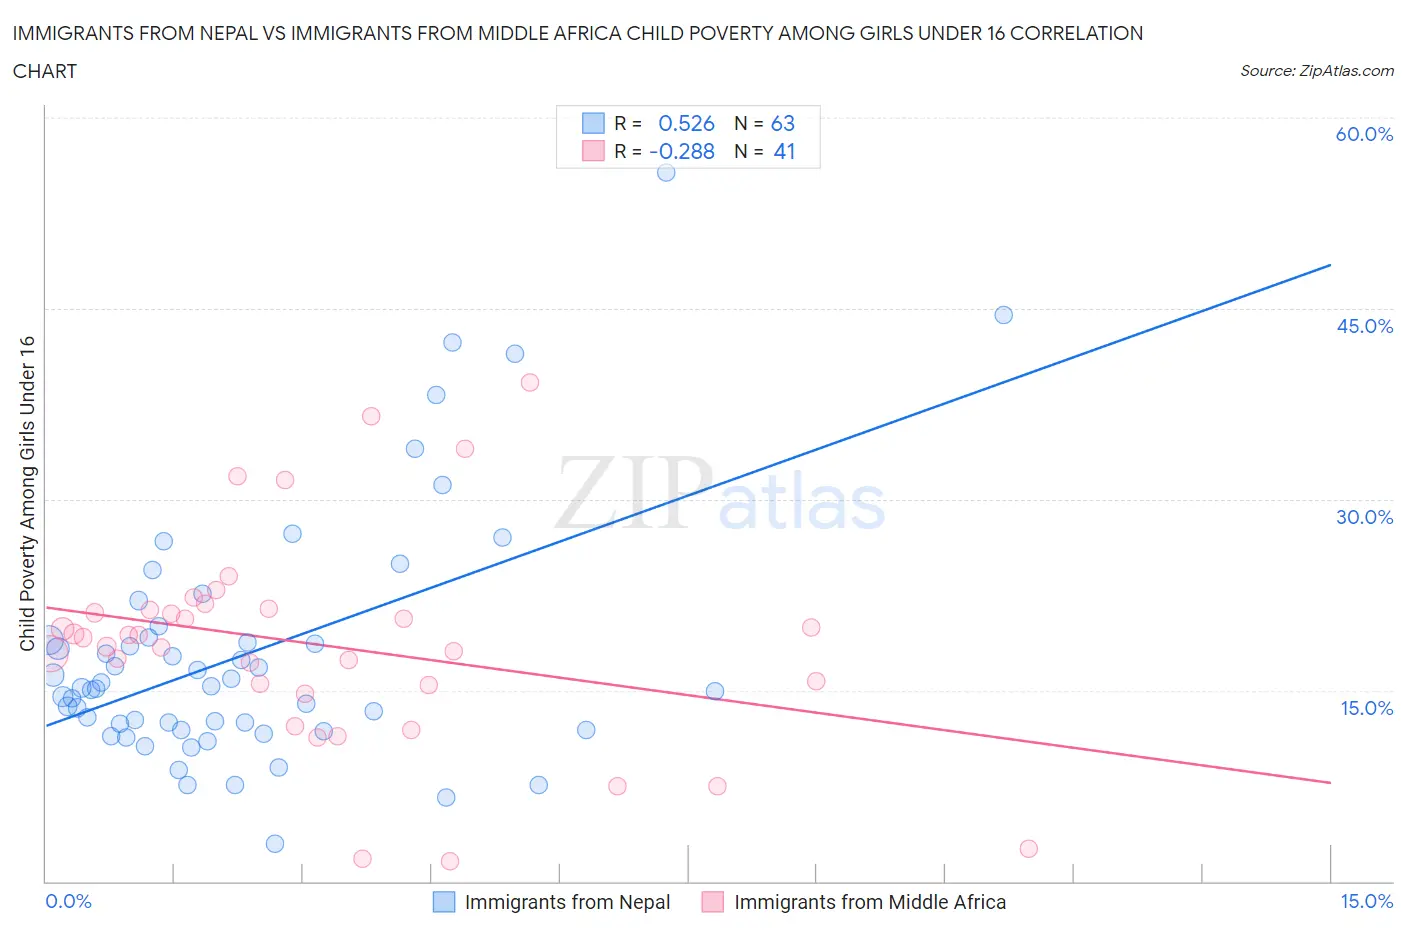
Immigrants from Nepal vs Immigrants from Middle Africa Child Poverty Among Girls Under 16 Correlation Chart

The statistical analysis conducted on geographies consisting of 185,239,456 people shows a substantial positive correlation between the proportion of Immigrants from Nepal and poverty level among girls under the age of 16 in the United States with a correlation coefficient (R) of 0.526 and weighted average of 15.9%. Similarly, the statistical analysis conducted on geographies consisting of 201,454,449 people shows a weak negative correlation between the proportion of Immigrants from Middle Africa and poverty level among girls under the age of 16 in the United States with a correlation coefficient (R) of -0.288 and weighted average of 19.2%, a difference of 21.4%.
Immigrants from Nepal vs Immigrants from Middle Africa Child Poverty Among Girls Under 16

Child Poverty Among Girls Under 16 Correlation Summary

MeasurementImmigrants from NepalImmigrants from Middle Africa
Minimum3.0%1.6%
Maximum55.7%39.2%
Range52.7%37.6%
Mean18.0%18.6%
Median15.2%19.1%
Interquartile 25% (IQ1)11.9%15.0%
Interquartile 75% (IQ3)19.1%21.4%
Interquartile Range (IQR)7.2%6.4%
Standard Deviation (Sample)9.9%8.3%
Standard Deviation (Population)9.8%8.2%

Similar Demographics by Child Poverty Among Girls Under 16

Demographics Similar to Immigrants from Nepal by Child Poverty Among Girls Under 16

In terms of child poverty among girls under 16, the demographic groups most similar to Immigrants from Nepal are Immigrants from Kuwait (15.8%, a difference of 0.15%), Venezuelan (15.8%, a difference of 0.29%), Immigrants from Chile (15.9%, a difference of 0.31%), Syrian (15.9%, a difference of 0.32%), and Immigrants from Albania (15.8%, a difference of 0.40%).
DemographicsRating | RankChild Poverty Among Girls Under 16
Samoans
84.2
/100
|
#146
Excellent
15.7%
Slavs
83.1
/100
|
#147
Excellent
15.7%
Icelanders
82.4
/100
|
#148
Excellent
15.7%
Immigrants | Hungary
80.9
/100
|
#149
Excellent
15.8%
Immigrants | Albania
80.7
/100
|
#150
Excellent
15.8%
Venezuelans
80.1
/100
|
#151
Excellent
15.8%
Immigrants | Kuwait
79.4
/100
|
#152
Good
15.8%
Immigrants | Nepal
78.5
/100
|
#153
Good
15.9%
Immigrants | Chile
76.7
/100
|
#154
Good
15.9%
Syrians
76.7
/100
|
#155
Good
15.9%
Immigrants | Fiji
76.1
/100
|
#156
Good
15.9%
Colombians
76.1
/100
|
#157
Good
15.9%
Guamanians/Chamorros
75.3
/100
|
#158
Good
15.9%
Slovaks
75.2
/100
|
#159
Good
15.9%
French
72.8
/100
|
#160
Good
16.0%

Demographics Similar to Immigrants from Middle Africa by Child Poverty Among Girls Under 16

In terms of child poverty among girls under 16, the demographic groups most similar to Immigrants from Middle Africa are Immigrants from Trinidad and Tobago (19.2%, a difference of 0.040%), Cape Verdean (19.2%, a difference of 0.15%), Potawatomi (19.2%, a difference of 0.18%), French American Indian (19.2%, a difference of 0.20%), and Immigrants from Guyana (19.3%, a difference of 0.20%).
DemographicsRating | RankChild Poverty Among Girls Under 16
Shoshone
0.6
/100
|
#245
Tragic
18.9%
Immigrants | Laos
0.6
/100
|
#246
Tragic
18.9%
Immigrants | Ghana
0.5
/100
|
#247
Tragic
18.9%
French American Indians
0.3
/100
|
#248
Tragic
19.2%
Potawatomi
0.3
/100
|
#249
Tragic
19.2%
Cape Verdeans
0.3
/100
|
#250
Tragic
19.2%
Immigrants | Trinidad and Tobago
0.3
/100
|
#251
Tragic
19.2%
Immigrants | Middle Africa
0.3
/100
|
#252
Tragic
19.2%
Immigrants | Guyana
0.3
/100
|
#253
Tragic
19.3%
Immigrants | Western Africa
0.3
/100
|
#254
Tragic
19.3%
Immigrants | Ecuador
0.3
/100
|
#255
Tragic
19.3%
Trinidadians and Tobagonians
0.2
/100
|
#256
Tragic
19.3%
Guyanese
0.2
/100
|
#257
Tragic
19.4%
Salvadorans
0.2
/100
|
#258
Tragic
19.4%
Ottawa
0.2
/100
|
#259
Tragic
19.4%